
Discover 7 sales report templates for SMBs in Excel and Google Sheets, featuring examples in MXN, key metrics, and automation with Swirvle.
An SMB doesn't need more columns, it needs a report that answers four questions: what it sold, when it sold, through which channel, and which customers returned. The most revealing data on Mexican commerce is not in the volume of digital companies, but in the relationship between adoption and income: in 2024, only 5.6% of economic units made online sales, but those sales represented 20.2% of the total national income of economic units, according to the definitive results of the 2024 Economic Censuses by INEGI.
This contrast forces a separation between over-the-counter, internet, WhatsApp, marketplace, delivery, and other channels, even if the business is still capturing data on a spreadsheet. This collection of sales report templates for SMBs is designed to copy and paste into Excel or Google Sheets, print, or export to PDF. It is not a compilation of finished examples, but an operational pack organized by frequency, business type, and complexity, with a path to choose between daily, weekly, monthly, quarterly, and campaign reports.
1. Daily sales template for coffee shops in simple MXN format
The coffee shop needs to detect when demand is concentrated and which products sustain each time slot. A simple daily sheet works better than a complex dashboard when the team registers sales during operation and needs to check the result at closing.
The structure can be copied as follows:
Date and time: records the time slot of each operational cut.
Product: separates coffee, desserts, cold drinks, and other items.
Quantity: indicates the units sold.
Unit price and total: calculates the amount in MXN.
Payment method: distinguishes cash, card, bank transfer, or digital wallet.
Notes: notes down promotions, shortages, events, or cash drawer incidents.
The daily report should not be limited to gross sales. It is also useful to consolidate number of receipts, average ticket, discounts, voids, cash discrepancy, and best-selling product. The administration guide for restaurant businesses recommends reviewing sales, discounts, voids, and cash daily, validating purchases and supplies weekly, and making pricing, menu, or staffing decisions monthly, following the operational logic for restaurants and physical businesses.
Example ready to copy
For an office coffee shop, a reference row can use gross sales of $18,450 MXN, 142 tickets, and an average ticket of $129.93, data included in this daily sales report example. The sheet should be updated every two hours, copy the formula row at the end of the day, and save a PDF version every Friday. Later on, Swirvle can connect the closing with loyalty campaigns, but manual capture must be consistent before automating it.
2. Weekly sales template for restaurants by service in MXN
The weekly total can mask the service that actually sustains the restaurant. Separating breakfast, lunch, and dinner allows relating revenue, foot traffic, menu options, and inventory to each operational period, on a sheet that can be copied to Excel or Google Sheets.
A practical structure is to use one row per day and service, with these columns:
Block | Fields |
|---|---|
Operation | Service, confirmed reservations, and covers or diners |
Sale | Gross revenue in MXN and average ticket |
Mix | Meats, seafood, vegetarian options, alcoholic and non-alcoholic drinks |
Context | Discounts, sides, key inventory, and shift notes |
The average ticket must be calculated using a stable criterion: revenue divided by tickets or divided by diners. Choosing a single formula for all weeks avoids misleading comparisons. Discounts and sides show whether the sales increase comes from a promotion, an upsell, or higher demand. Inventory connects the commercial result with purchases and supply consumption.
Reading of the week
The decision does not depend on the day with the highest revenue. A service with many diners and a low ticket may require reviewing combos, prices, or suggestive selling. Another with fewer visits may justify a targeted promotion, as long as the discount does not reduce the margin to the point of making it unprofitable.
Every Monday, duplicate the sheet and compare the previous week. Colors can highlight underperforming services, but management should also review events, weather, promotions, remodeling, and other recorded notes. Adaptable sales report structures for restaurants, such as those in this daily sales report example, include daily and weekly sales, food and beverage categories, discounts, and complementary items.
Customer segments allow activating coupons for frequent visitors during slow shifts. To measure that action, keep the service, the channel, the identified customer when available, and the campaign code. After validating manual capture, the template can be connected to Swirvle to move toward automated reports without losing the spreadsheet's operational criteria.
3. Monthly template for barber shops by service and barber in MXN
A barber shop can close the month with good revenue and still not know which services sustain the result or how productivity is distributed among professionals. The template records each appointment or sale to compare activity, revenue, and capacity used without turning the analysis into a simple ranking.
The registry can be organized by barber, service, and new vs. recurring customers. Add haircuts, beard trims, designs, and hot towel shaves as separate categories. For each operation, keep the completed services, revenue in MXN, and duration. Complete the row with discounts, cancellations, and no-shows, in addition to quality notes about incidents or training needs.
The monthly view should combine five insights: number of services, total revenue, average ticket, hours worked, and recurrence. The Team Total row offers a basis for comparison, but it does not determine who works better. A professional may attend fewer appointments because they perform longer or higher-priced services.
The manager can use conditional formatting to highlight days with fewer than 5 services. This threshold only makes sense if it reflects an operational rule of the barber shop. It does not work as a universal standard.
To implement it, link the sheet to the appointment system and transfer the date, professional, service, and status of each reservation. This reduces duplicate data entry. At the close of the month, review services with the least movement and decide if you need to improve recommendations, execution, or upselling. The same registry allows tracking referrals, provided that each new customer retains their acquisition source and subsequent return.
4. Monthly template for beauty salons by professional in MXN
A salon needs to measure productivity without confusing occupancy with profitability. A chair occupied for many hours can produce less revenue than a higher-value service performed with a better-organized schedule. That is why this template incorporates professional, service, duration, and recurrence.
The base can be divided by stylist, manicurist, and therapist, with these fields:
Professional and station: chair, cabin, or station used.
Type of service: cut, color, treatment, nails, or massage.
Duration and downtime: shows actual utilization.
New or recurring customer: allows observing retention.
Price, discount, and net revenue: distinguishes nominal sales from effective sales.
Revenue per hour: relates money to available time.
Commission: facilitates a transparent conversation with the team.
Rebooking or next appointment: connects the current sale with continuity.
Reading per hour
The revenue-per-hour formula avoids rewarding only the person who accumulates the most services. A professional with fewer appointments can generate a significant contribution if they handle longer and higher-value treatments, while another may need to improve occupancy or retail sales.
The recommended price table should be kept separate from the historical registry. Thus, management can compare the price applied, discount, and result without overwriting each month's conditions. The downtime field also allows distinguishing a schedule with low demand from a poorly distributed schedule.
The monthly report should be shared with the team in a version that protects sensitive data that is not necessary for the operation. The conversation works best when focused on revenue per hour, recurrence, occupancy, and training opportunities, not just on commissions.
5. Multi-channel monthly template for coffee shops or restaurants in MXN
Comparing sales by channel without subtracting their costs can lead to wrong decisions. A coffee shop or restaurant can sell the same product in-store, through delivery, catering, and corporate orders, but each path alters the commission, logistics, labor time, and chance of repeat purchase.
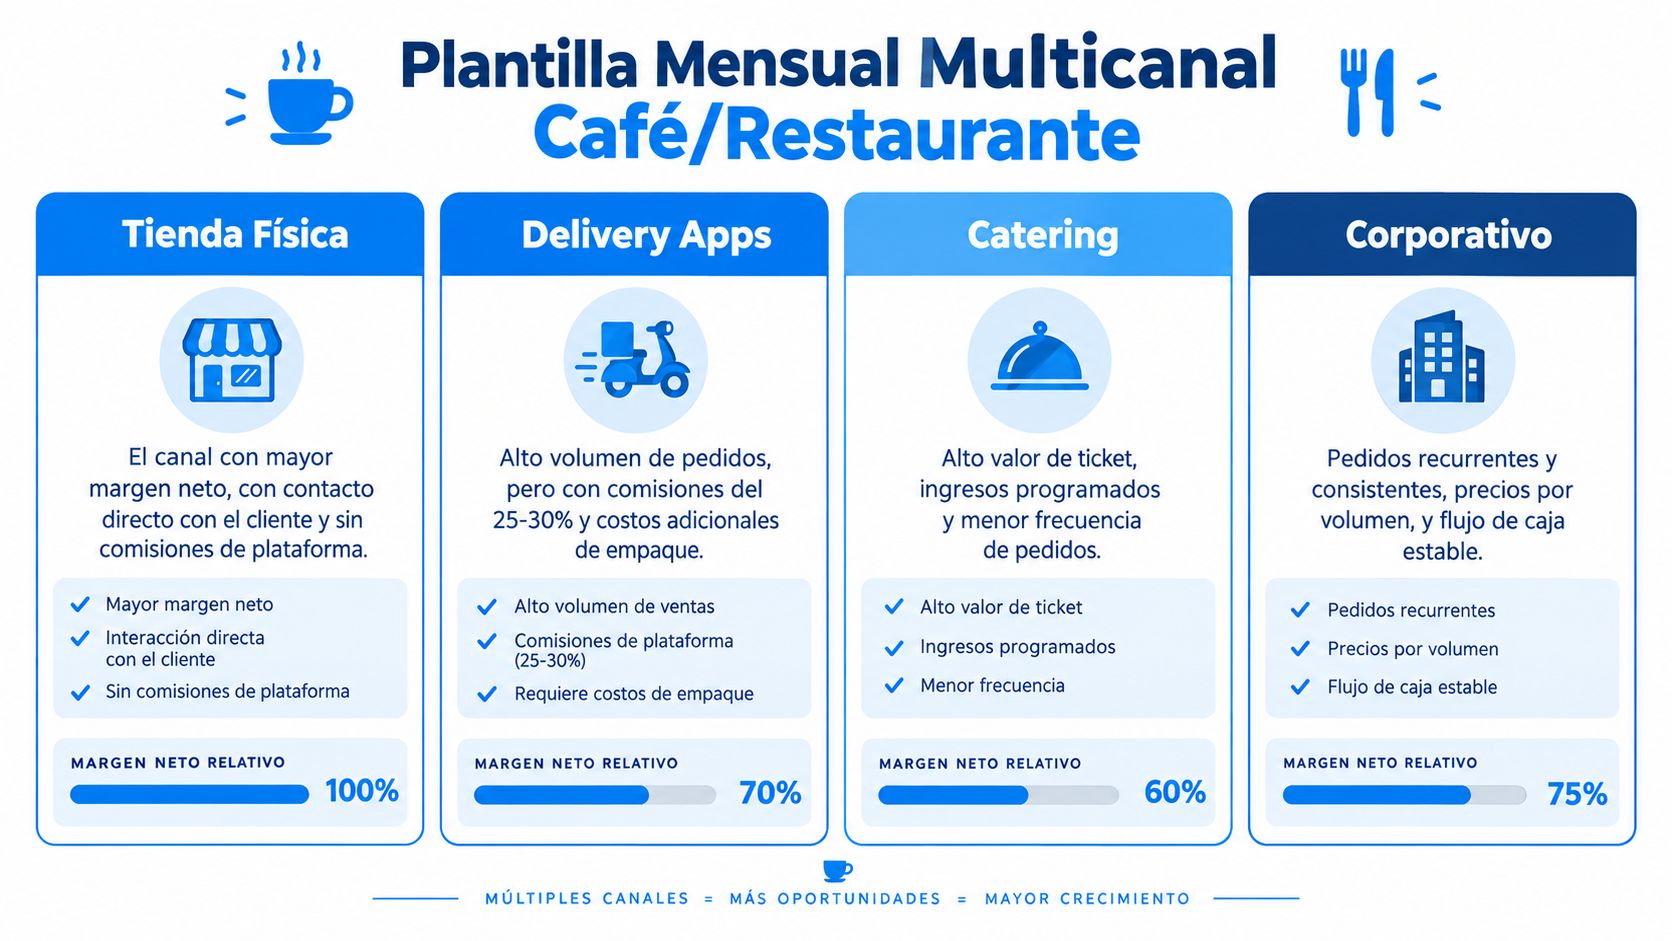
The sheet can be organized with one row per channel and month. Record Channel, Product and units, Gross revenue in MXN, Delivery cost, Platform commission, Discounts and returns, Net margin per channel, and Identified customer and repurchase. These fields separate the collected value from the money that actually remains and link the sale to retention.
It is advisable to keep revenue and margins on different panels. The channel with the highest sales volume might bring in less profit after commissions, shipping, and discounts. A single total sales column hides this difference.
From exporting to tracking
Implementation can begin with monthly exports from each channel. Afterwards, dynamic formulas allow testing how results change when modifying commissions, shipping costs, or discounts. A bar chart summarizes the comparison, while the decision must consider net margin, recurrence, and operational capacity.
The definitive results of the 2024 Economic Censuses indicate that 61.1% of units that made online sales used the economic unit's website, according to the definitive results of the 2024 Economic Censuses by INEGI. Therefore, the proprietary channel deserves a separate field even if it still records few transactions. Swirvle can use this data to send exclusive coupons to physical store customers and measure their return.
6. Consolidated quarterly template to compare branches in MXN
An SMB with multiple locations needs a common view to prevent each manager from interpreting "sale," "ticket," or "recurring customer" differently. This template consolidates the daily reports of each branch and transforms them into a base for deciding on investment, staffing, inventory, and continuity.
The quarterly sheet for each branch can include:
Revenue by period and channel: retains the commercial mix.
Tickets and average ticket: allows comparing the quality of sales.
Goal and achievement: relates the result to expectation.
Percentage growth: compares equivalent periods, not arbitrary periods.
Leading products or services: detects local patterns.
New and recurring customers: separates expansion from loyalty.
External events: records promotions, remodels, or disruptions.
Annual closing forecast: presents a hypothesis, not a certainty.
Comparison without distortions
Management must standardize periods and definitions before ranking branches. A shopping mall location may have different hours, foot traffic, and events compared to a street-front branch. Red or green formatting helps spot exceptions, but it doesn't replace the notes explaining why a store fell below or exceeded the internal average.
Consolidation can be automated when all daily reports use the same branch names, categories, payment methods, and return rules. The guide for standardizing branch operations is highly relevant for defining that common ground before connecting sheets.
The quarterly report must be shared with managers and heads of each location. The meeting needs to end with assigned decisions, a review date, and a concrete hypothesis—for example, testing a change in product assortment at one branch or reviewing the budget for a local campaign.
7. Daily sales and campaign ROI template with Swirvle in MXN
The sales report becomes a marketing tool when it connects a transaction to a specific campaign. The daily template must distinguish between total sales, sales from impacted customers, redeemed coupons, and the cost of the initiative, without attributing every subsequent purchase to a message.
The essential fields are:
Date and branch: sets the context of the sale.
Campaign and channel: WhatsApp, email, push, or coupon.
Impacted customers: records the reached audience.
Converted customers: counts attributable purchases under a defined rule.
Attributable revenue in MXN: sums the linked sales.
Campaign cost: includes discounts and operational spending.
ROI: applies a documented formula, such as attributable result minus cost, divided by cost.
Observations: keeps codes, validity, and conditions.
Controlled attribution
A unique QR or coupon in Swirvle makes it easy to know which campaign generated a purchase. The template should be updated at the close of each day and compare WhatsApp, email, and push under the same attribution window. If a person received multiple messages, the team must choose a consistent rule to avoid duplicating revenue.
Examples with sales amounts, customers, or ROI percentages should only be used when they come from the SMB's real records. The formula can be documented with the explanation of how ROI is calculated, but the result belongs to each campaign and should not be assumed before reviewing costs, redemptions, and sales.
Daily analysis is useful for reallocating budget between channels, adjusting the incentive, or changing the segment. A campaign with many redemptions might attract sales from customers who would have bought anyway, while another with fewer coupons might reactivate lapsed customers. The sheet should help prove this difference, not hide it behind an appealing percentage.
Comparison: 7 sales report templates for SMBs
Template | Scope / Frequency | Key features | Value proposition | Integration / Ease of use |
|---|---|---|---|---|
Daily Coffee Shop Sales Template - Simple MXN Format | Daily (Coffee Shops) | Tracking by time slots; categories (hot/cold/food); automatic totals; payment methods | Identifies peak hours, facilitates cash reconciliation and daily comparisons | Immediate implementation; manual entry; Excel/Sheets ready; potential link with Swirvle |
Weekly Restaurant Sales Template - Breakdown by Service MXN | Weekly (Restaurants) | Columns by service (Breakfast/Lunch/Dinner); average ticket; covers and occupancy; totals and comparison | Detects the most profitable service; optimizes staffing and inventory | Requires cash drawer-kitchen coordination; useful with POS; Excel/Sheets with charts |
Monthly Barber Shop Template - Services by Barber MXN | Monthly (Barber Shops) | Revenue by barber; service types; new vs. recurring; monthly comparison | Measures productivity, retention, and serves for commission calculations | Manual post-transaction logging; Excel with pivot tables; integrates with bookings |
Monthly Beauty Salon Template - Services by Professional MXN | Monthly (Salons / Spas) | Multiple professionals; service categories; duration; station occupancy | Optimizes space utilization, staffing, and commissions | Requires data entry discipline; complex with >10 professionals; Excel/Sheets with charts |
Monthly Multi-channel Coffee/Restaurant Template - Store + Delivery + Catering MXN | Monthly (Multi-channel) | Breakdown by channel (in-store, delivery, catering, corporate); commissions; shipping costs; net margin | Identifies the most profitable channels and optimizes investment per channel | Needs to integrate multiple systems; macros/Apps Script recommended; more complex maintenance |
Consolidated Quarterly Template - Branch Comparison MXN | Quarterly (Chains / Multi-location) | Rows by branch; 3 months + total; % growth; performance index; annual projection | Consolidated executive view; detects underperforming branches | Requires clean data; automated consolidation; Excel/Power BI |
Daily Sales Template + Campaign ROI - Swirvle Link MXN | Daily (with weekly/monthly consolidation) | Daily sales; campaigns (channel and name); impacted customers; attributable revenue; automatic ROI calculation | Connects marketing with sales in real time; measures and justifies campaign ROI | Direct integration with Swirvle (recommended); Google Sheets with API; automatable |
From sales archive to a decision system
The safest path starts with a single frequency. A coffee shop or barber shop with irregular data capture should adopt the daily template first. A restaurant that already closes its cash drawer with discipline can start with the weekly one. An SMB with multiple locations can keep the daily reports and add the quarterly consolidation when all branches use the same definitions.
The first level consists of recording revenue in MXN, tickets, average ticket, channel, payment method, product or service, and operational notes. The template must have input fields clearly separated from formulas. It must also record the period, the branch, and the person responsible, because a total without context does not allow investigating a deviation.
The second level appears when data capture is consistent. Then, it's beneficial to add purchase frequency, new customers, recurring customers, retention, sales by professional, and sales by branch. The goal is not to fill the spreadsheet with indicators, but to explain what drives the result. A coffee shop might discover that the problem is not daily sales, but the low repetition of certain customers. A salon might detect that downtime reduces profit contribution more than service pricing.
The third level connects campaigns, coupons, and attributable sales in Swirvle. The platform centralizes customer information, allows segmentation by consumer habits and branch, and runs campaigns via WhatsApp, push notifications, and email. Its dashboards and automations can complement the spreadsheet when the SMB needs to measure recurrence, attribution, and ROI, although the available details may change.
Control before deciding
Before discussing results, each person in charge must verify:
Completeness: no days, branches, channels, or payment methods are missing.
Consistency: categories and names are always written the same way.
Reconciliation: sales, tickets, payments, discounts, and cash correspond to the same closing.
Comparability: periods have explained operational conditions.
Traceability: each campaign has a code, coupon, or attribution rule.
Action: each finding ends with an assigned decision, responsible party, and review date.
The cadence also matters. The operational team can review the daily close, management can analyze trends weekly, and leadership can make decisions regarding assortment, staffing, prices, or investment during the monthly or quarterly review. A template saved without a conversation is not a decision-making system. To delve deeper into that link between data and action, you can refer to the explanation of how ROI is calculated.
The practical approach is to choose a template, copy it into Excel or Google Sheets, define the capture rules, and test it for a full period. Afterwards, the business can visit the Swirvle site to learn about its automation options and available dashboards, keeping in mind that its features and details may change.
Swirvle centralizes customer data, segmentation by habits and branch, WhatsApp, email, and push campaigns, coupons, and dashboards to link sales to loyalty. To turn these SMB sales report templates into a measurable operation, it is recommended to review Swirvle and choose the automation that matches the frequency and complexity of your business.
Related Blogs

Nov 21, 2026
How to Connect Your POS System with Restaurant Email Marketing: A Guide

Nov 20, 2026
How much does a small restaurant make per month in Mexico?

Nov 19, 2026
How to Run a Small Coffee Shop Step by Step? 2026

Nov 18, 2026
How can you check out customers faster in a coffee shop during peak hours?

Nov 17, 2026
How to create a loyalty program for a clothing store or boutique?

Nov 16, 2026
How to manage a coffee shop's inventory day by day?