
Discover sales analytics to optimize your business: define KPIs, segment customers, and maximize profitability from your POS.
A sales analysis answers questions like: which products pay the rent? during which hours do we actually sell? how many customers are new vs. returning? which promo actually moved the needle? It is not the same as a report, a dashboard, or a record: analysis is the judgment applied to that data.
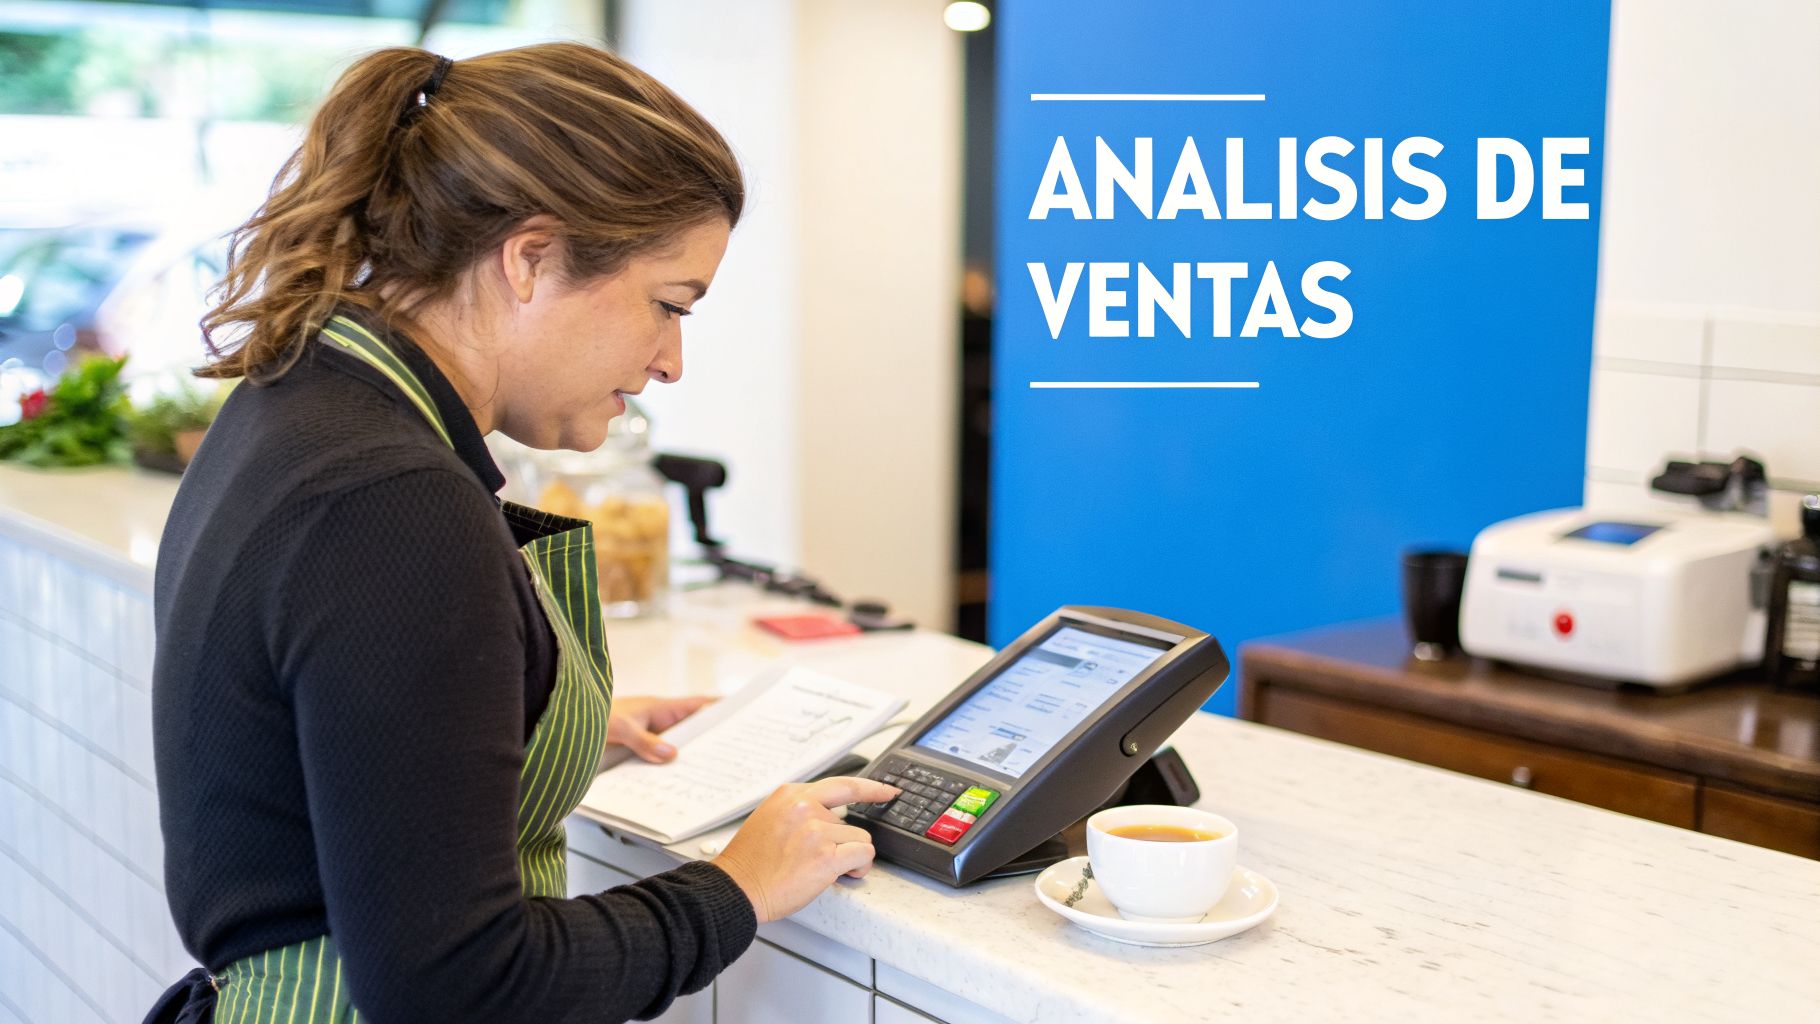
Step-by-step monthly sales analysis (4 views)
1) By product (Pareto / ABC)
Sort products by sales or margin. Look at the handful that concentrates results (A), the middle (B), and the tail (C). Decision: reinforce A, review price/cost of B, clean up or reposition C. Without inventing percentages: use your own ranking.
2) By day and hour
Simple ticket heatmap. Decision: staffing, promos only during off-peak times, short menu during peaks.
3) By customer (new vs. returning)
If you identify customers at checkout: how many tickets are from returning customers and who didn't come back. Decision: onboarding of new vs. reactivation. Templates: sales report templates.
4) By channel or promotion
Compare periods with/without promo or channel (dine-in, takeout, etc.). Decision: kill promos that only bring discounts without repeat business. Profitability: profitability analysis.
Reduce generic “segmentation” and “ROI” to a single paragraph: segmenting customers helps with view 3; campaign ROI is judged with view 4 —no entire rewrites of those topics here.
Why sales analysis is your best ally
Have you ever wondered why Tuesdays are so slow at your restaurant or why a certain product at your barbershop runs out without warning? Sales analysis is the tool that gives you those answers, turning raw data into a clear map for growth. It is the big difference between running your business based on intuition and leading it with the certainty that facts provide.
For any SMB in Latin America, where every peso must stretch as far as possible, ignoring sales data is like trying to navigate the open sea without a compass. It is a risk you simply cannot afford.
From raw data to smart decision
Let's look at a practical case. Imagine you own a coffee shop. Your daily report tells you that you sold 100 lattes. That is fine, but it does not tell you much.
A true sales analysis would show you that 70 of those lattes were sold between 8 and 10 a.m., and that 60% of those customers also bought a croissant. Suddenly, you have pure gold in your hands.
With that simple piece of information, you can already take action:
Optimize your staff: You make sure to have your best baristas on the morning shift to handle the peak of customers smoothly.
Create smart promotions: You launch a "latte + croissant" combo with a small discount during those hours. The goal: to raise your average ticket even further.
Better manage your inventory: You know you need to order more coffee beans and croissants right before the weekend to avoid running out of stock.
Instead of just reacting when problems arise, analysis allows you to anticipate them. It transforms you from a business owner who puts out fires into a strategist who prevents them, using the information that your own operation generates every day.
A car wash, for example, might discover that its "premium wax" service is most popular on Saturday afternoons. With that data, they can launch an SMS campaign targeted at customers from those hours, offering them a discounted interior cleaning on their next visit. Every sale becomes an opportunity to secure the next one.
For this process to truly work, it is crucial to understand its key components. A good analysis relies on solid pillars ranging from data collection to concrete action.
Pillars of an actionable sales analysis
Here is a summary of the components that every SMB owner must master for their sales analysis to generate tangible results.
Component | Main Objective | Practical Example (Restaurant) |
|---|---|---|
Data Collection | Centralize sales information (POS, CRM) in one place to have a complete and unbiased view. | Connect the point-of-sale software with a spreadsheet to record every dish, time, and payment method. |
Relevant KPIs | Measure what actually matters (average ticket, customer retention, etc.) to avoid getting lost in vanity metrics. | Instead of just counting tables, measure the average spend per diner and the monthly visit frequency. |
Segmentation | Group customers or products by common characteristics to understand specific behaviors. | Identify customers who always order the daily special vs. those who order à la carte dishes and wine. |
Analysis and Visualization | Turn numbers into easy-to-interpret charts and tables so anyone on the team can understand them. | Create a simple dashboard showing sales by day of the week and the most popular dishes with bar charts. |
Action and Automation | Use findings to make informed decisions and, if possible, automate responses. | If the analysis shows that Tuesdays are slow, automate an email campaign with a free dessert to be sent out every Monday. |
Mastering these pillars is what will allow you to move from simply "having data" to "using data" to grow your business in a sustainable and predictable way.
Define your key metrics to start measuring what matters
Before diving headfirst into the numbers, you need to be clear about what you are looking for. Starting a sales analysis without defining your Key Performance Indicators (KPIs) is like hitting the road without a destination; you will waste gas, time, and effort and end up nowhere.
Every business has its own rhythm and its own priorities. The metrics that matter to a restaurant will not be the same as those for a barbershop or a clothing store. The key lies in choosing indicators that help you make real decisions, not just collect data that looks pretty on a report.
KPIs that actually move the needle
If you run an SMB, you do not need to drown in an endless list of metrics. It is much smarter to focus on a few that directly impact your profitability.
Here are three fundamental KPIs that work for almost any physical business:
Average Ticket: This is the pulse of every sale. It measures how much a customer spends, on average, each time they buy from you. Think about it: for a coffee shop, an increase of just $1 in the average ticket can translate into thousands of additional dollars per month.
Purchase Frequency: This tells you how often a customer returns in a specific period. A car wash, for example, does not just want customers; it wants customers who return every 2 weeks, not every 2 months. That is where profitability lies.
Customer Lifetime Value (CLV): This is the strategic metric par excellence. It projects how much money a customer will generate for you throughout their entire relationship with your business. CLV tells you, without beating around the bush, how much you can afford to spend to attract and, above all, to keep a good customer.
These three indicators give you an accurate X-ray of your business's health. With them, you can answer critical questions: Are my customers spending more over time? Am I successfully getting them to return? How much is a loyal customer worth to me in the long run?
The final goal is not just to sell more today. It is to build a customer base that spends more on each visit and returns more frequently. A barbershop customer who returns 5 times and spends $200 is infinitely more valuable than 5 customers who come only once and spend the same.
The foundation of everything: clean data in one place
It does you no good to define the best KPIs in the world if the information you use to calculate them is a mess. Manual entry errors, duplicate customers, or incomplete records will lead you to make decisions based on falsehoods.
Imagine a restaurant that wants to know what its star dish is. If the servers enter it with a different name every time ("chilaq.", "green chilaquiles", "chilaqs grn"), the analysis will be useless and you could end up removing your best-selling product from the menu.
This is where a good point-of-sale (POS) system that includes a CRM becomes your best ally. Its job is to centralize and standardize all information automatically. Every sale records what was sold, to whom, when, and for how much, without you or your team having to juggle files.
This automation guarantees that your sales analysis always starts from a reliable database. Without clean, organized data, any strategy you design will be built on shifting sand, ready to collapse at the first push.
How to segment your customers to personalize your offer
If you treat all your customers the same, you are making a mistake that costs many SMBs dearly. The true key to making your marketing work and growing your sales sustainably lies in segmentation. It is nothing more than grouping your customers based on what they do and what they prefer, so you can speak to them in a way that truly connects.
And this is precisely where sales analysis comes in. It is the tool that allows you to perform this segmentation with surgical precision, using the data you already generate every day.
Go beyond demographics
Forget about segmenting only by age or gender. The information that is truly worth gold lies in purchasing behavior. Your POS system, especially if it has an integrated CRM, is a goldmine for finding these patterns.
Imagine you own a coffee shop. Instead of thinking about "young customers," you can create much more useful and actionable groups:
Cold Brew Fans: Customers who order this drink at least three times a month.
The Weekend Crowd: People who only visit you on Saturdays or Sundays.
Office Orders: Those who buy coffee and pastries to go in large quantities during the week.
Each of these groups has different needs and motivations. If you are interested in diving deeper into the subject, you can learn more about what customer segmentation is in our article and how to apply it to your business.
Practical examples of behavioral segmentation
Behavioral segmentation allows you to personalize what you offer in a super effective way, no matter what your business is. It is not about guessing, but about using your sales data to truly understand your customers.
In a barbershop:
Your analysis could show you two key groups. First, the "Loyal Customers", who have more than 5 recorded visits in the last 6 months. On the other hand, you have the "Single-Service Customers", who come in for a basic haircut but have never tried the shaving service or a beard treatment.
In a restaurant:
You could identify your "Night Owls", who always book after 8 p.m., and the "Dessert Lovers", whose average ticket skyrockets because they always order something sweet at the end.
The best part about using a POS system with CRM is that these segments are not fixed; they update on their own. If a "single-service customer" in your barbershop finally tries a shave, the system can automatically move them to the "Premium Customers" group.
From segmentation to direct sale
Once you have your customers well grouped, the next step is to take action. Segmenting for the sake of segmenting is just an academic exercise. The ultimate goal is to send the right message to the right person at the right time.
This is where automation becomes your best ally, allowing you to create highly targeted campaigns that feel personal and relevant:
For the Cold Brew Fans of your coffee shop: How about sending a push notification on a Friday afternoon? Announce a new seasonal flavor or a 2-for-1 offer on pastries when they buy their favorite drink.
For the Loyal Customers of your barbershop: Send them a discount coupon via WhatsApp as a thank you. Invite them to be the first to try that new hair product that just arrived.
This level of personalization not only raises the chances of a sale but also strengthens the relationship with your customers. It makes them feel valued and understood. That is the true power of sales analysis when properly applied to segmentation.
Strategies to increase average ticket and purchase frequency
Once you know who your customers are and what they buy, the next logical step in your sales analysis is to use that information to pull the two levers that most impact revenue: making each customer spend a bit more on each visit and getting them to return more often.
These two actions are the true engine of sustainable growth. It is not a race to get thousands of new customers, but rather to build a much more solid and profitable relationship with those who already trust you.
How to boost the average ticket using your data
The smartest way to increase what a customer spends is through cross-selling and upselling (offering something of higher value). But this is not a guessing game. The key is to let your own data guide the way.
Your POS system is a goldmine. That is where the buying patterns you need are hidden. For example, a barbershop owner could analyze their sales and discover that 30% of customers who get a haircut also buy styling wax. With that data in hand, the strategy becomes obvious:
Create smart combos: Put together a "Haircut + Wax" package with a small discount. The customer feels they are getting an extra benefit, and you, without realizing it, have just increased the value of that transaction.
Train your team: Train the barbers to naturally recommend the wax at the end of the service, explaining why it is the perfect product for that new cut.
In a restaurant, the analysis might reveal that tables ordering a particular bottle of wine tend to spend 25% more on desserts. This is a very clear signal for servers to suggest pairings or for the chef to design a special menu that boosts that winning combination.
The secret is not to push products at random. It is to identify the connections that already exist in your customers' behavior and simply make them more visible and attractive to them.
Purchase frequency as a driver of profitability
Bringing in a new customer costs a fortune compared to keeping one you already have. That is why any serious growth strategy must have loyalty as a pillar. This is where loyalty programs, powered by your CRM data, become your best allies.
A good rewards program does not just reward a purchase; it creates a cycle of visits. Think of a coffee shop that offers a free coffee after five purchases. Data analysis allows you to know if the initiative is actually working.
Measure the real impact: Compare the visit frequency of customers enrolled in the program against those who are not. Are they really returning faster?
Segment your fans: Identify your top 10% most loyal customers and give them VIP treatment with exclusive rewards. Make them feel special, because they are.
In fact, a recent trend shows that sales growth for many SMBs is driven more by an increase in the average ticket than by a higher volume of items. A recent report pointed out that while the average ticket grew by 16.1%, units per transaction only rose by 9.7%. This underscores the urgency of focusing on strategies that increase the value of each visit. You can learn more details about this retail trend in Mexico.
For businesses with subscription models, such as a car wash with monthly memberships or a gym, it is vital to understand how systems like SEPA direct debit for companies work to ensure automatic collection and foster that frictionless repeat business. If you want to dive deeper into how to land these ideas, we recommend reading our article on combining a CRM and a loyalty program to take your business to the next level.
Measure the return on your marketing campaigns and promotions
Launching a 2-for-1 promotion via SMS or a social media campaign is just the beginning. The real question, the one that keeps us all up at night, is: did it actually work? A good sales analysis gives you the tools to stop relying on hunches and start precisely measuring the impact that every peso invested in marketing has on your cash flow.
The goal is simple: stop throwing money away and start investing it intelligently. You need to know if that campaign brought in new customers, if it simply pulled forward sales that were going to happen anyway, or if, in the worst case, it had no effect at all.
Linking marketing and sales at your point of sale
The key piece of this puzzle is attribution. In short, it is the ability to connect a specific sale to the marketing campaign that originated it. This is where a POS system that also functions as a CRM becomes your best ally, creating a direct bridge between your marketing actions and in-store results.
Let's look at a practical example. Imagine you own a restaurant chain and want to boost weekday sales with a coupon campaign via WhatsApp.
You create the coupon: You generate a unique, easy-to-remember discount code, like "CRAZYTUESDAY".
The customer uses it: A customer comes to pay, shows the coupon on their phone, and the cashier enters it into the POS system.
The magic of attribution: At that very instant, the system links that sale to the customer's profile and tags it as part of the "CRAZYTUESDAY" campaign.
This simple process opens your eyes. You go from guessing to having hard data on how well your promotions are working in the real world.
Calculate the return on investment (ROI)
Once you can attribute sales, the next logical step is to calculate the Return on Investment, or ROI. This metric is fundamental because it tells you exactly how many pesos you earned for every peso you invested in a campaign. It allows you to compare apples to apples and see which strategy gives you more bang for your buck. If you want to dive deeper into the formula and its importance, you can explore what ROI in marketing is in our detailed guide.
Let's look at another case. A car wash decides to launch two campaigns at the same time:
Campaign A (Email): A 15% discount on premium wax, sent to their email list.
Campaign B (SMS): A 2-for-1 on basic wash, targeted at customers who have not visited in the last 90 days.
At the end of the month, the sales analysis might reveal something interesting: Campaign A generated an ROI of 300%, attracting customers who spend more, while Campaign B barely reached an ROI of 50%. With this information in hand, you now know where to put your budget next month.
Attribution allows you to identify which channels (email, WhatsApp, social media) and which offers connect best with your most profitable customers. It is the difference between shooting with a shotgun and shooting with a sniper rifle.
This integration of channels is increasingly important. In fact, retail sales in Mexico recently increased, driven largely by online and catalog sales, which soared by 20.5%. This trend underscores how vital it is to connect your digital efforts with the in-store physical experience, something only a unified system can achieve. You can see more about Mexican retail trends here.
Automation takes this to another level. Imagine configuring your system to automatically send a "we miss you" coupon with a special discount to any customer of your barbershop who reaches 60 days without a visit. That way, your marketing works for you on autopilot, reactivating customers and generating sales without you having to lift a finger.
Visualize your data in dashboards to make better decisions
A sales analysis, no matter how deep it is, is not very useful if it stays filed away in a spreadsheet with thousands of rows. The reality is that raw, unorganized data does not facilitate agile decision-making. Therefore, the last step —and one of the most important— is to transform all that information into visual and intuitive dashboards. Think of them as your business's dashboard, telling you the story of what is happening at a single glance.
The goal here is to stop looking at isolated numbers and start identifying patterns. A well-built dashboard allows you to detect in seconds, not hours, a drop in sales at a branch or a peak in demand for a specific product.
The right chart for each KPI
Not all charts communicate the same thing. Choosing the right visualization is fundamental for the information to be clear and, above all, actionable. The goal is for anyone on the team, from the store manager to the cashier, to understand what is happening without needing to be a data expert.
Here are some practical ideas on how to apply it:
Bar charts: They are your best allies for making direct comparisons. For example, a barbershop with multiple locations could use them to see the total sales of each one during the last month. You will immediately know which one is generating the most revenue.
Line charts: Perfect for showing how something has evolved over time. Use them to monitor your restaurant's average ticket over the last quarter. Do you see an upward or downward trend? This chart will tell you instantly.
Pie charts: They work very well to show the composition of a total. If you own a car wash, you could use one to break down what percentage of your revenue comes from each service: basic wash, wax, interior cleaning, etc.
What is crucial is that this information is not a static end-of-the-month photo. Modern point-of-sale platforms update these dashboards in real-time, giving you a constant and precise pulse of your operation.
A dashboard is not a report reviewed once a month. It is the control panel of your business. It must always be visible and updated so you can react quickly to any change, whether good or bad.
Automation and AI for deeper analysis
Today's technology allows us to go a step further. It is no longer just about visualizing what happened, but about making systems work for you proactively.
This workflow is a good example of how to measure the real impact of campaigns, from the moment they are launched until their return on investment is analyzed.
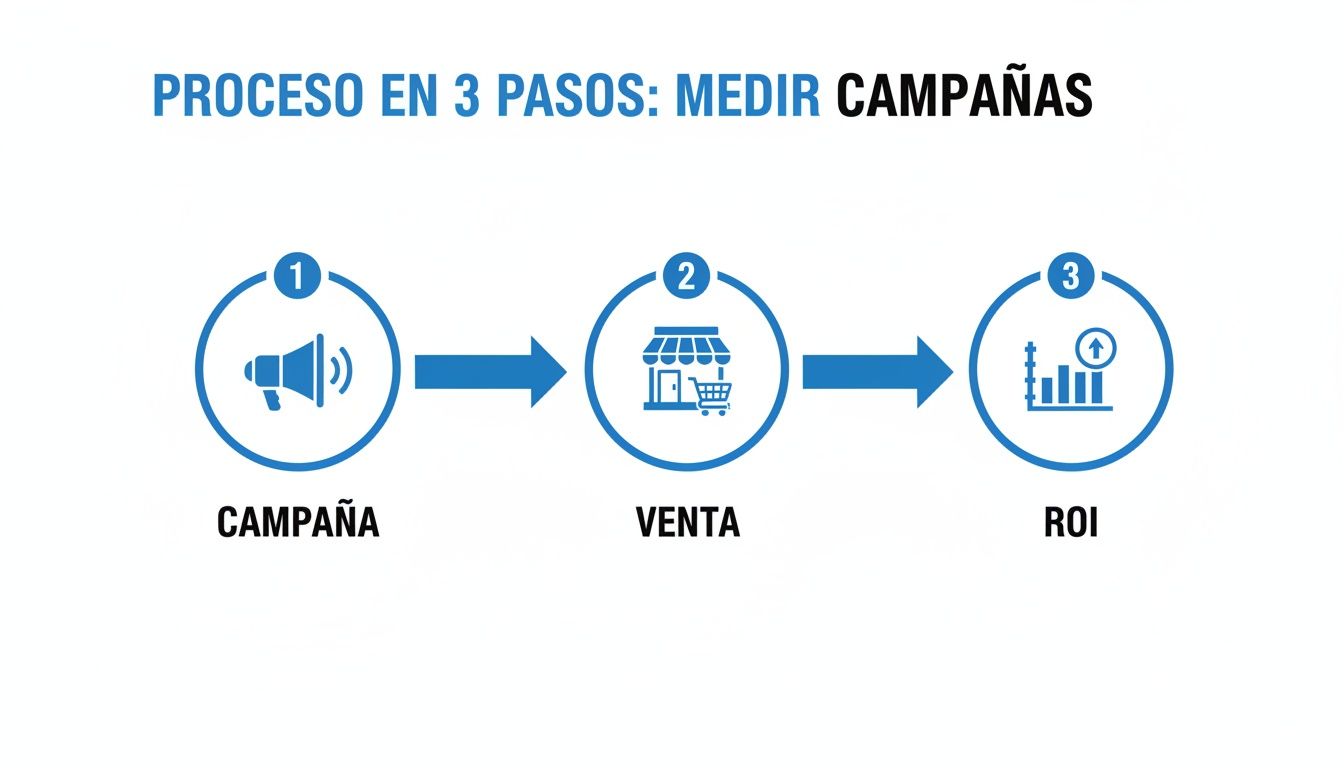
As the image shows, the key is to connect each campaign directly to a sale to be able to measure its ROI precisely. Without that connection, you are just guessing.
Automation helps you in very concrete ways. For example, you could set up alerts to notify you via email or WhatsApp if the average ticket at one of your coffee shop's locations falls below a threshold you define. That way, you can intervene before a small setback becomes a major problem. Artificial intelligence, for its part, can identify high-potential customer segments that you might have overlooked, suggesting opportunities that were not obvious.
If you are interested in diving deeper into how to put this into practice, I recommend reading more about data-driven decision-making and the impact it can have on your business.
At the end of the day, the goal is simple: spend less time building reports and more time executing the strategies those very reports are suggesting to you.
Frequently asked questions about sales analysis
To close, let's resolve some of the most common doubts that always arise when implementing a sales analysis in an SMB. The idea is to give you direct and practical answers so you can start with complete confidence.
How often should I do a sales analysis?
The key here is consistency, not intensity. It is not about spending hours every day drowned in spreadsheets, but about finding a rhythm that actually works for your business.
A good practice is to take a daily or weekly look at your most important KPIs, such as total sales or average ticket, directly from your dashboard. This gives you a quick, near real-time pulse of how the operation is going.
Then, schedule a time once a month for a deeper analysis. In that session, you dive into exploring the behavior of certain customer segments (for example, the customers who visit your restaurant the most on weekends), the performance of your star products, and any trends starting to emerge. Finally, do a quarterly and an annual analysis to evaluate the overall strategy and adjust the course for the long term.
I am a small business, do I really need a CRM and a POS?
The short answer is: yes, absolutely. For a small business, like a neighborhood coffee shop or a barbershop with two chairs, every customer counts double and every minute you save is pure gold. Trying to run a sales analysis manually with notebooks or spreadsheets is a recipe for disaster: it is full of errors, takes up extremely valuable time, and worst of all, prevents you from seeing the whole picture.
Think of a POS system with an integrated CRM not as an expense, but as a direct investment in efficiency and growth. It automates data capture, eliminates human error, and gives you marketing tools that would be impossible to manage by hand.
This technology puts you on a level playing field, giving you the ability to understand and connect with your customers from day one.
What do I do if my analysis shows a drop in sales?
First of all, don't panic! That is exactly what analysis is for: to detect problems early, before they turn into a crisis. The first thing is to stay calm and start investigating the "why" behind those numbers.
The analysis itself will give you clues:
Did the average ticket drop at your coffee shop? Perhaps your team needs a refresher on techniques to suggest a dessert or a larger coffee (upselling).
Are your loyal barbershop customers coming in less often? It might be the perfect time to launch a reactivation campaign with a discount on their next cut.
Is the problem concentrated in your restaurant during lunchtime? It's time to talk to the kitchen and front-of-house teams to understand what is happening on that specific shift.
Once you identify the root cause, you can act with precision. You launch a specific promotion, adjust your inventory, or train your staff. The analysis not only shows you the problem but also illuminates the path to the solution.
A sales analysis is your map for transforming data into utility. With tools like Swirvle, you stop guessing and start making decisions that truly increase your revenue, improve your customer loyalty, and secure sustainable growth. Discover how our all-in-one platform can help you take your business to the next level.
New Frequently Asked Question
What is the difference between a sales analysis, report, and dashboard?
The record captures; the report summarizes a period; the dashboard visualizes in near real-time; the analysis interprets and decides. Guides: record, report, dashboard.
Related Blogs

Nov 21, 2026
How to Connect Your POS System with Restaurant Email Marketing: A Guide

Nov 20, 2026
How much does a small restaurant make per month in Mexico?

Nov 19, 2026
How to Run a Small Coffee Shop Step by Step? 2026

Nov 18, 2026
How can you check out customers faster in a coffee shop during peak hours?

Nov 17, 2026
How to create a loyalty program for a clothing store or boutique?

Nov 16, 2026
How to manage a coffee shop's inventory day by day?