How much does a grocery store make per month in Mexico? Sales, costs, and net profit explained with hypothetical examples in MXN and key metrics for 2026.
There is no official INEGI figure for the monthly profit of an individual grocery store in Mexico. The basic formula is sales minus the cost of goods sold minus fixed expenses.
That's why answering with a monthly sales figure, as if it were money available to the owner, leads to the wrong conclusion. To know how much a store actually earns, you need to separate what was collected, what it costs to replace the products sold, and what it takes to keep the business open.
How much a grocery store makes per month: the direct answer
Profit is calculated from each store's own books, not from a single national figure that applies to everyone. A store in an owned space run by family members has a different cost structure from one that pays rent and employees, even if both record similar sales.
Official data shows how the sector is performing, but not how much an owner can take home. In March 2026, the retail subsector for groceries, food, beverages, ice and tobacco recorded a year-over-year change of −6.2% in real revenue, according to INEGI's Monthly Survey of Commercial Companies.
That aggregate result is not a drop in profit attributable to each store. Nor does it let you turn a store's sales into an expected profit: its cost of goods, operating expenses and taxes are missing.
What each grocery store figure measures
Concept | What it measures | What it's for |
|---|---|---|
Gross sales | Total collected at the register during the period | Measure volume and trends |
Gross profit | Sales minus the cost of goods sold | Evaluate product margins |
Operating profit | Gross profit minus fixed and operating expenses | See whether the business is sustainable |
Net profit | What's left after taxes | Estimate what the owner can take out |
The table sets an order for the analysis. First, identify how much was sold; next, how much the products left; finally, whether that result was enough to cover operations and the related obligations.
Hypothetical example in Mexican pesos: collecting 30,000 MXN a month does not mean earning 30,000 MXN. That amount still has to cover the goods sold, rent, electricity, wages, fees, shrinkage and any applicable taxes.
How to read it: a revenue figure without its costs describes commercial activity, not profitability.
Even net profit needs careful interpretation before you take it out. The business may need cash to pay suppliers, restock inventory or meet outstanding commitments, so profit and the cash available in the register don't always match.
The question how much does a grocery store make a month in Mexico? has a useful answer once you identify the period and the concept being measured. This article is for informational purposes only and does not constitute financial or tax advice; the treatment of taxes, deductions and owner compensation should be reviewed with an accountant.
Why sales aren't profit and how to calculate it
The calculation works like a funnel: what you collect from sales goes in, the cost of the products sold comes out, and then operating expenses are subtracted. The resulting balance still has to be distinguished from after-tax profit.
INEGI's 2019 Economic Census records revenue, expenses and inventory separately, among other variables. That separation avoids treating sales revenue as if it were an individual business's profit.
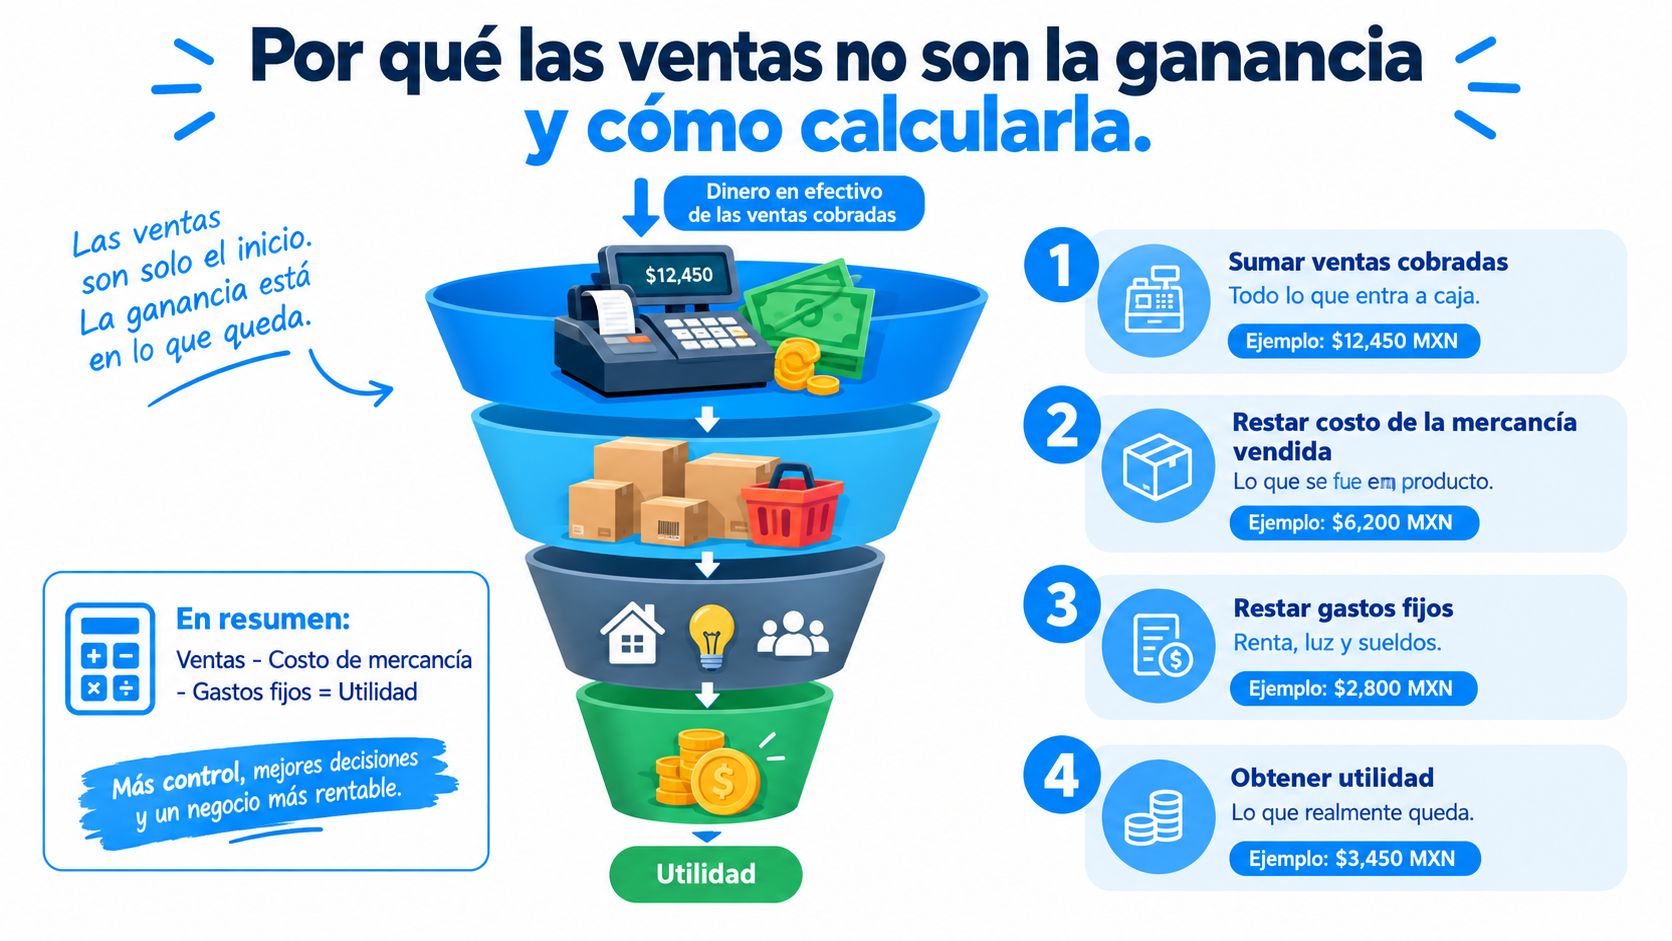
The monthly close calculation
Add up the period's sales. The record should reconcile cash, electronic payments, returns and discounts, without mistaking owner contributions for sales.
Subtract the cost of goods sold. This applies only to product that went out as a sale. In a hypothetical inventory example, if you bought 50 cases of soda and sold 30, only the cost of those 30 cases belongs to the month's sales; the rest remain in inventory.
Deduct fixed expenses. These include rent, base payroll and utilities for the same period.
Record other expenses and losses. Fees, expired products and shortages should be recognized without double-counting them in the cost of goods.
Separate operating results from taxes. Net profit is then determined with the appropriate accounting and tax treatment.
The difference between purchases and cost of goods sold is especially important when you restock before the close. The guide on how cost of sales is determined goes deeper into that record.
The owner's personal withdrawals are not, by themselves, operating expenses: they should be kept separate from formal pay for their work. Otherwise, you lose clarity about how much the business produced and how much money went to the household.
Hypothetical monthly case in MXN: if sales were 120,000, the cost of goods sold 84,000 and fixed expenses 25,000, with no other pending operating expenses, the calculation would be:
Operating profit = 120,000 − 84,000 − 25,000 = 11,000 MXN before taxes.
This is an illustrative exercise, not an INEGI average. The practical rule is to identify how much of what you sold remains after covering the product and operations.
Breakdown of the costs subtracted from each sale
Cost control requires receipts and inventory records, not estimates made while checking the register. Each outflow should be classified by its nature and assigned to the corresponding period.
The following table works as a monthly checklist. Its purpose is to avoid omissions, but also to prevent the same cost from being subtracted in different categories.
Grocery store costs and how to measure them
Cost | What it includes | How to measure it | Common mistake |
|---|---|---|---|
Merchandise | Products sold, at purchase cost | Cost of goods sold, calculated from beginning inventory, purchases and ending inventory | Counting everything purchased as that month's expense |
Rent | Monthly rent for the space | Fixed amount in the lease | Forgetting the opportunity cost of an owned space |
Payroll | Wages, payroll taxes and payments to staff | Sum of payments for the period | Not including the time the owner spends serving customers |
Utilities | Electricity, water, gas, internet and phone | Monthly bills | Ignoring the power used by refrigerators and freezers |
Taxes | Obligations under your tax regime | Calculated with an accountant | Treating the VAT you collect as your own income |
Shrinkage | Expired, damaged or stolen product | Physical counts and write-off records | Measuring it only at year-end |
To reconcile inventory, you can use the relationship beginning inventory + net purchases − ending inventory, with adjustments for write-offs, returns and movements that aren't sales. If shrinkage was already recognized through those adjustments, it shouldn't be subtracted again as an additional loss.
An owned space requires another distinction: not paying rent is not the same as using a property at no economic cost. To evaluate alternatives, you can estimate what you would forgo by not renting it to someone else, without recording a fictitious rent as a cash outflow.
Something similar happens with the owner's time. The books should reflect actual payments and their proper treatment; the economic analysis can add, separately, the cost of hiring someone to do that work.
Separating costs to make decisions
Fixed costs: rent and base payroll stay committed even if sales volume changes within current capacity.
Variable costs: merchandise and card terminal fees change with sales; part of shrinkage can also be tied to handling volume.
Mixed costs: utilities can combine base charges and usage, so it's worth reviewing the bills before classifying them.
This separation lets you calculate the break-even point without attributing every expense to the product. A tracking sheet with categories in rows and months in columns makes it easier to compare costs against sales for the same period and spot increases that need an explanation.
What changes profit based on size and location
A bigger store doesn't guarantee a bigger profit. It may sell more and, at the same time, need more inventory, staff, refrigeration and space.
INEGI's DENUE directory, updated with data from the 2024 Economic Census, lists more than 6 million establishments across different activities in Mexico and lets you look them up by location and size. That universe isn't limited to grocery stores, nor does it set an official profit range by neighborhood.
Factors worth comparing
Owned or rented space. Rent creates a monthly obligation; an owned property reduces that outlay but keeps capital tied up. Comparing only the cash balance favors the owned space without showing the full investment required.
Location and foot traffic. A spot with more pedestrians may capture more purchases and demand higher rent. It's worth looking at how many people buy, at what times, and how much those sales leave after the cost of the product.
Size and product mix. Expanding the catalog can meet new needs, but it can also pile up slow-moving stock. The decision should consider turnover, expiration dates and capital invested by category.
Owner-run or hired staff. A family-run operation can reduce payroll outlays, even though the owner puts in hours that don't show up as an expense. The comparison should keep that work visible.
Formality and tax regime. Applicable obligations and deductions should be reviewed with an accountant before projecting available cash.
A store near offices might concentrate transactions at certain times of day; one in a residential area might have a different purchase pattern. Neither scenario lets you assign an automatic profit: you need to look at the store's own tickets and costs.
Your own profit range is more useful than someone else's average when it's built from comparable months and complete records.
From context to break-even point
As a diagnostic procedure, you can gather the last three months of sales, costs and tickets, calculate the operating profit for each month and identify what changed. This isn't a statistical sample of the sector, but an initial review of the business.
The break-even point is expressed as required sales = fixed costs ÷ contribution margin ratio. That ratio is obtained with (sales − variable costs) ÷ sales, and it's only useful if the cost classification and product mix represent the operation being evaluated.
Hypothetical examples: café, bakery and grocery store
All amounts in the following exercises are hypothetical, expressed in MXN per month, and do not represent official averages or results from real businesses. The expenses shown are assumed to cover the example's operations, with no other pending items before taxes.
The formula used is profit before taxes = sales − cost of products or ingredients − fixed expenses. The comparison shows why higher revenue doesn't necessarily produce a higher profit.
Hypothetical monthly profit example in MXN
Concept (MXN per month) | Café | Grocery store |
|---|---|---|
Monthly sales | 60,000 | 120,000 |
Cost of products or merchandise | 18,000 | 84,000 |
Fixed expenses | 20,000 | 25,000 |
Profit before taxes | 22,000 | 11,000 |
Under these assumptions, the café earns 60,000 − 18,000 − 20,000 = 22,000 MXN before taxes. The store earns 120,000 − 84,000 − 25,000 = 11,000 MXN, despite recording higher sales.
The explanation lies in the structure of the example: the café spends less on ingredients per peso sold, while the store resells merchandise at a thinner margin. That doesn't prove that every café is more profitable than every store.
Other businesses under the same hypothetical formula
Illustrative business | Hypothetical sales | Hypothetical ingredient cost | Hypothetical fixed expenses | Hypothetical profit before taxes |
|---|---|---|---|---|
Bakery | 90,000 MXN | 36,000 MXN | 32,000 MXN | 22,000 MXN |
Restaurant | 150,000 MXN | 52,500 MXN | 70,000 MXN | 27,500 MXN |
Tortilla shop | 70,000 MXN | 35,000 MXN | 13,000 MXN | 22,000 MXN |
The full calculations for these hypothetical cases are:
Bakery: 90,000 − 36,000 − 32,000 = 22,000 MXN before taxes.
Restaurant: 150,000 − 52,500 − 70,000 = 27,500 MXN before taxes.
Tortilla shop: 70,000 − 35,000 − 13,000 = 22,000 MXN before taxes.
The hypothetical gross margin, calculated as (sales − cost of products) ÷ sales, would be 70% for the café, 60% for the bakery, 50% for the tortilla shop and 30% for the grocery store. These are mathematical results of the assumptions, not typical margins for those types of business.
Here, the bakery and the tortilla shop earn the same profit on different sales. The café keeps a larger share after ingredients, but it still has to pay for labor and the other resources included in its expenses: a high gross margin is not net profit.
As a reference for its economic importance, grocery and food retail employed 1,817,910 people in Mexico, according to INEGI's 2019 Economic Census. That figure shows the weight of the sector, not how much each store earns.
The takeaway for the store in the exercise is concrete: it needs to evaluate volume, turnover and repeat purchases together. Comparing itself with the percentage of a business that prepares food would hide the operational differences.
Key metrics to measure ticket, frequency and margin
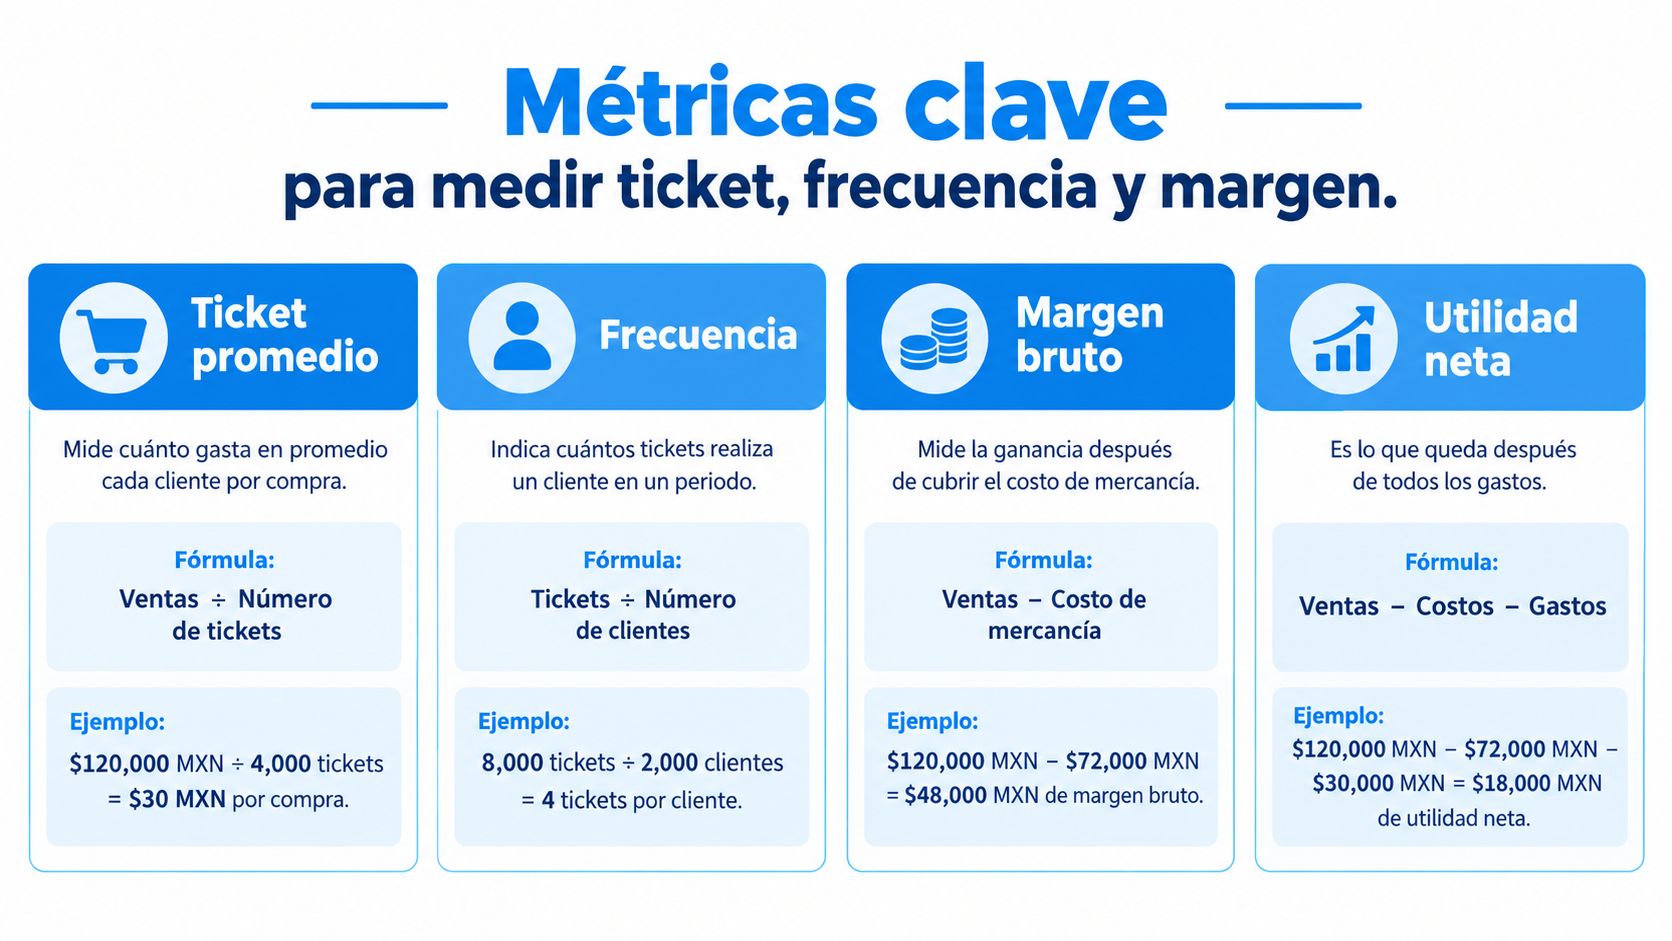
Diagnosis improves when each metric answers a different question. The ticket measures the amount per purchase; frequency, the recorded visits per customer; margin, the share available before expenses.
All values in the following table are hypothetical assumptions, not official statistics. Monetary amounts are expressed in MXN.
Key metrics with formula and hypothetical example
Metric | Formula | Hypothetical example | What it shows |
|---|---|---|---|
Average ticket | Sales ÷ number of tickets | 120,000 MXN ÷ 4,000 tickets = 30 MXN per purchase | How much is spent on each purchase |
Purchase frequency | Identified tickets ÷ identified customers | 4,000 identified tickets ÷ 800 customers = 5 monthly visits per customer | How often registered customers come back |
Gross margin | (Sales − cost of goods) ÷ sales | (120,000 − 84,000) ÷ 120,000 = 30% | How much remains from each peso before fixed expenses |
Margin by category | (Category sales − its cost) ÷ category sales | Cold drinks, 18%; basic groceries, 25%, as illustrative assumptions | Which product families sustain profit |
The explanation of what average ticket is helps you interpret that ratio without confusing it with monthly spending per person. One customer can generate several tickets, and one purchase can include products for different people.
Frequency requires a consistent base: only divide identified tickets by identified customers from the same period. Mixing all transactions with only a portion of registered shoppers would produce an inflated metric.
How to turn metrics into decisions
A higher ticket can come from low-margin products or costly discounts. That's why it's worth reviewing both the purchase amount and the contribution it leaves at the same time, rather than celebrating higher revenue in isolation.
Margin by category doesn't replace turnover, either. Turnover can be calculated as cost of goods sold ÷ average inventory at cost: it shows how much inventory turned into sales during the period.
To evaluate a promotion, the relevant calculation is incremental result = additional contribution − incentive cost − other execution costs. The additional contribution should be compared with a reasonable baseline of sales without the campaign, rather than attributing every promotional purchase to the incentive.
Decision rule: an action improves profit when the additional contribution exceeds what it cost to achieve it.
Strategies to raise profit and your next step
The priority is to fix losses and protect contribution before funding more sales with discounts. Increasing visits is useful when the additional purchases leave enough to cover the incentive and operations.
The importance of the sector also means looking at local supply: among microbusinesses with up to 10 people, 19.4% were grocery and food retailers, according to the national results of INEGI's 2019 Economic Census. The figure puts their national presence in context, but on its own it doesn't measure competition in a given neighborhood.
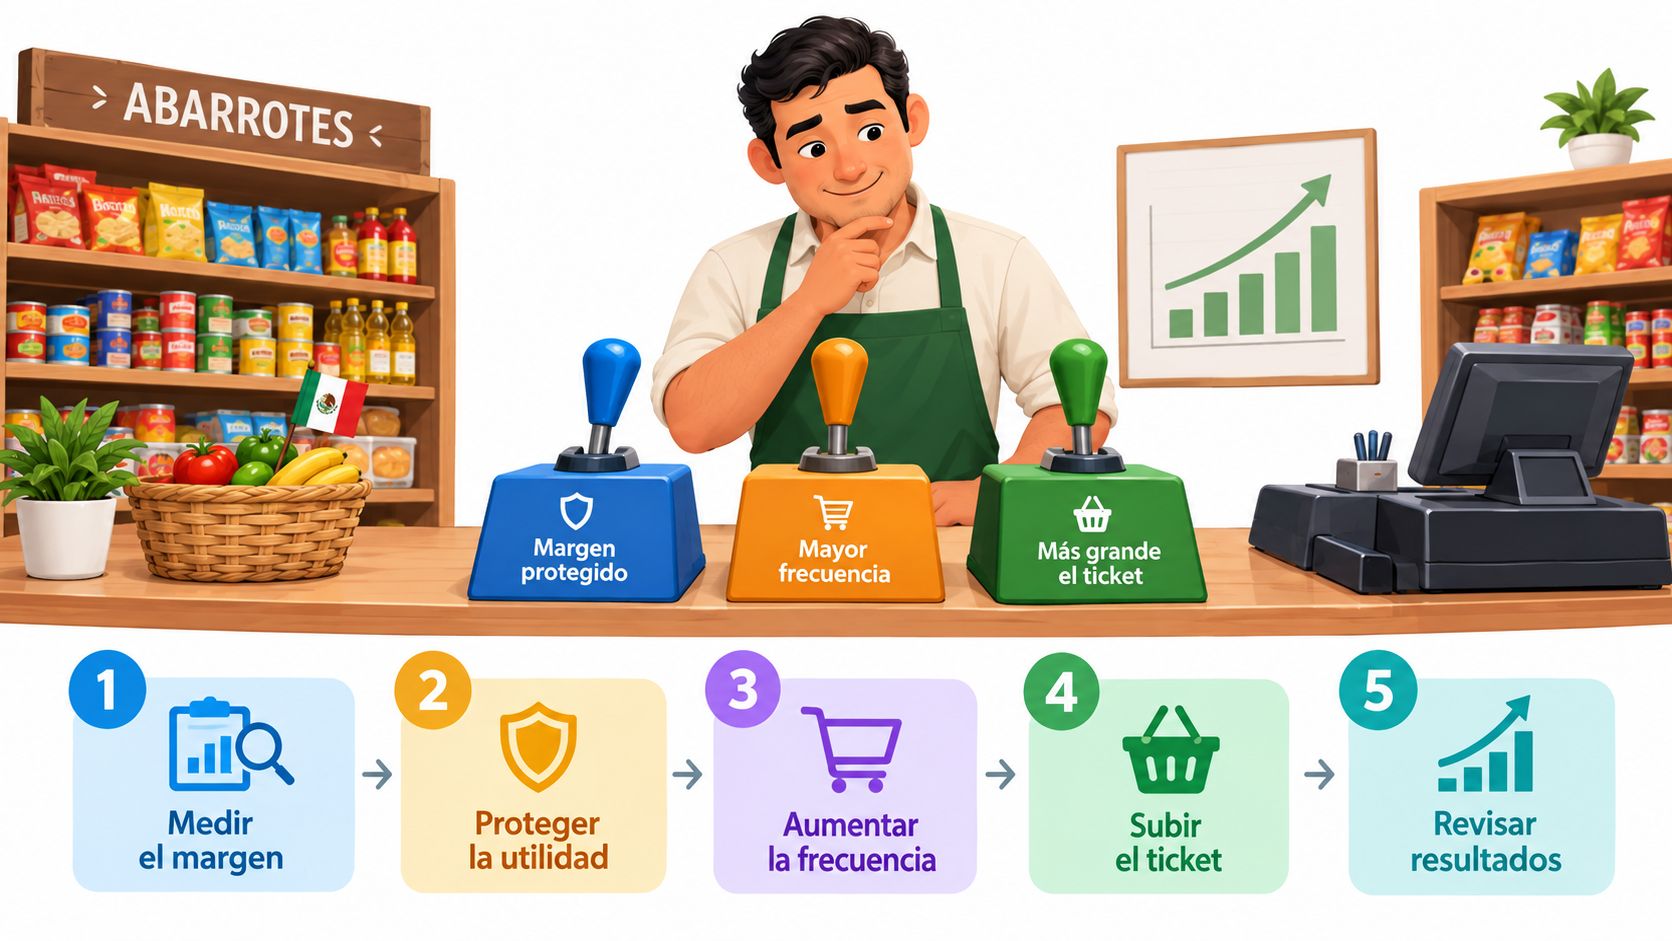
Ordered actions to protect your results
Review contribution by category. Shelf space can be reallocated toward product families that combine margin, demand and turnover. Dropping a product based only on its percentage margin would be hasty if it drives profitable purchases of other items.
Reduce shrinkage. A monthly count, along with expiration date checks and immediate write-off records, helps identify products that are bought faster than they sell. Merchandise closest to expiring should be easy to reach so it sells first.
Identify repeat and inactive customers. It's worth separating regular shoppers from those who haven't come back in more than a month. Outreach should take into account their history and the relevant permissions, instead of sending the same offer to everyone.
Design sustainable rewards. Visit- or points-based programs need a calculated cost before launch. The condition is that the contribution from additional purchases exceeds the expected cost of the rewards and their administration.
Test measurable local campaigns. An action by neighborhood or time slot should be compared with a comparable period, recording discounts, products sold and estimated contribution. The goal isn't to credit all sales to the campaign, but to tell apart what likely happened because of it.
Ideas to attract more customers to a grocery store should be filtered with that criterion: how much they cost, what behavior they aim to change, and what result would justify keeping them. A campaign without that definition can add work without improving profit.
A monthly close you can act on
Swirvle POS lets you take payments in the cloud, control inventory, record supplier purchases and see sales in real time; it also handles recipes and modifiers and deducts ingredients with each sale, features that help you compare sales and costs when the data is entered correctly.
The concrete next step is to calculate operating profit for the last three months and compare each period's contribution with its fixed expenses. If the gap comes from shrinkage, focus on inventory; if it comes from a less profitable product mix, review your assortment and promotions before chasing more traffic.
The initial decision should be written down with an action, an owner and an evaluation criterion. That way, the owner can verify whether the financial result improved, not just whether there was more activity at the register.
Swirvle offers point of sale, inventory control and customer relationship tools to connect recorded sales with operating and repeat-customer decisions. To see how to understand your business's real sales and margins with correctly recorded costs, you can visit Swirvle and explore its solutions.
Related Blogs

Oct 28, 2026
How much does a grocery store make per month in Mexico? 2026

Oct 27, 2026
How to attract more customers to my grocery store in 2026?

Oct 26, 2026
8 ideas: What promotions can I run for Buen Fin if I have a small business?

Oct 25, 2026
What thank-you messages should I send to my customers?

Oct 24, 2026
What questions should you ask in a restaurant satisfaction survey? 8 ideas

Oct 23, 2026
Is it legal to charge a card payment fee in Mexico?