What questions should you include in a restaurant customer satisfaction survey? A guide with 8 examples, NPS scales, and templates for WhatsApp and CRM.
Why can a rating of 9 hide a cold dish, a confusing bill, or an order that arrived late? Because a generic satisfaction question lumps food, service, and timing into a single number, and that number doesn't tell you what to fix tomorrow.
What to measure before asking is service, food, and recurrence. A useful survey doesn't ask about everything. It measures what explains whether a customer returns, recommends you, or stays quiet. Here are the 8 questions across service, food, atmosphere, and timing, using NPS, CSAT, and CES scales, ready for on-premise, WhatsApp, and email, and with a direct bridge to your CRM.
The decision starts with the objective, not the form. If the business is looking for word of mouth, the scale runs from 0 to 10. If it wants to compare shifts, 1 to 5 is enough. If the issue is friction when ordering or booking, an effort scale is needed, not another flavor star rating.
On-premise, a receipt QR code or an exit tablet captures the visit while it's still fresh. On WhatsApp, the message arrives hours later, leaving room for a brief reason. In email, the same block serves anyone who provided their email address with consent. Each channel should use the same anchors, plus location, date, purchase channel, and visit type, so the dashboard compares locations rather than just showing a monthly average.
Eight questions, not an interrogation. Each one has an operational owner: kitchen, bar, floor, reception, or the rewards program. The question of what questions to include in a restaurant customer satisfaction survey is resolved this way, one business objective at a time.
1. NPS Question: "How likely are you to recommend our business to a friend or family member?"
The NPS doesn't measure today's dish. It measures whether that person would speak well of the business. The scale is from 0 to 10. Promoters are 9 and 10, passives are 7 and 8, and detractors are 0 to 6. The index subtracts the percentage of detractors from the percentage of promoters. It works for restaurants, coffee shops, and stores because it separates an acceptable visit from one that can generate word-of-mouth recommendations.
In Tamaulipas, a study of 383 restaurant customers conducted in October and November 2024 found that service quality positively and significantly influences satisfaction, and that satisfaction in turn influences loyalty, according to modeling published by Periplo. That is why the recommendation question doesn't travel alone. It goes along with overall satisfaction and the likelihood of returning within 30 days, using consistent 0 to 10 scales for loyalty.

A coffee shop can ask for the NPS from anyone who pays by card or app and compare the downtown branch with the mall location. A restaurant can send it via WhatsApp 24 hours later and review only the detractors each week. The calculation of the index, by location and by period, is detailed in the Net Promoter Score guide.
Second open-ended question: ask for the reason behind the score, not an essay.
Timing of delivery: avoid sending it right after a complaint, as anger skews loyalty.
Breakdown by location: calculate the NPS by branch and by month, not just the brand's overall average.
Response time: act on detractors in under 48 hours, with the receipt and location already linked to the profile.
Reading rule: a high chain-wide NPS does not excuse the location that concentrates detractors during the lunch shift.
2. CSAT Question: "How satisfied were you with your visit today?"
The CSAT rates a specific visit, almost always from 1 to 5 or with five stars. It doesn't predict long-term loyalty. It tells you whether that service, that barista, or that shift went well. That is why it fits right at the restaurant exit, on the table QR code, or when closing out the check at the coffee shop.
In Toluca, a survey of 300 diners using the SERVPERF model positively and significantly linked five dimensions with satisfaction: empathy, assurance, responsiveness, reliability, and tangibles. Assurance—understood as trust, competence, and secure service—had the highest influence, according to research by the UAEM. Empathy and reliability were not always significant when analyzed alongside the others. A single happy face doesn't explain the visit.
How to Read CSAT by Shift

A restaurant can place a tablet at the exit with five faces and view the average per shift. A coffee shop can send stars after each order and count each barista's score, not the brand's. The open-ended comment field only appears if the rating is 1, 2, or 3. This protects the response rate and focuses open feedback on what needs fixing.
Clear anchors: 1 is very dissatisfied and 5 is very satisfied, identical across all locations.
Operational breakdown: compare day of the week and shift before blaming the menu.
Internal use: share the weekly result with the team to reinforce what is working, not just the complaints.
The assurance question fits here on the same scale. "How safe did you feel?" and "Did the staff resolve your questions clearly?" detect perceived competence, which carried more weight than the other attributes in Toluca.
3. CES Question: "How easy was it to place your order or book your table?"
The CES (Customer Effort Score) measures effort, not flavor. The typical scale runs from 1 (very difficult) to 7 (very easy). It is useful when the complaint isn't the product but the process: a confusing app, an overcrowded counter, modifiers that don't save, or a reservation that can't be changed.
In Mexico, the CGA by NielsenIQ On Premise report, with 1,200 bar and restaurant visitors, found that 91% were satisfied or very satisfied with service quality, according to the NielsenIQ report. A score that high says little on its own: the channel, the menu, and the conversation with staff change the experience, and they are not the same attribute.
Specific Tasks, Not the Entire Visit
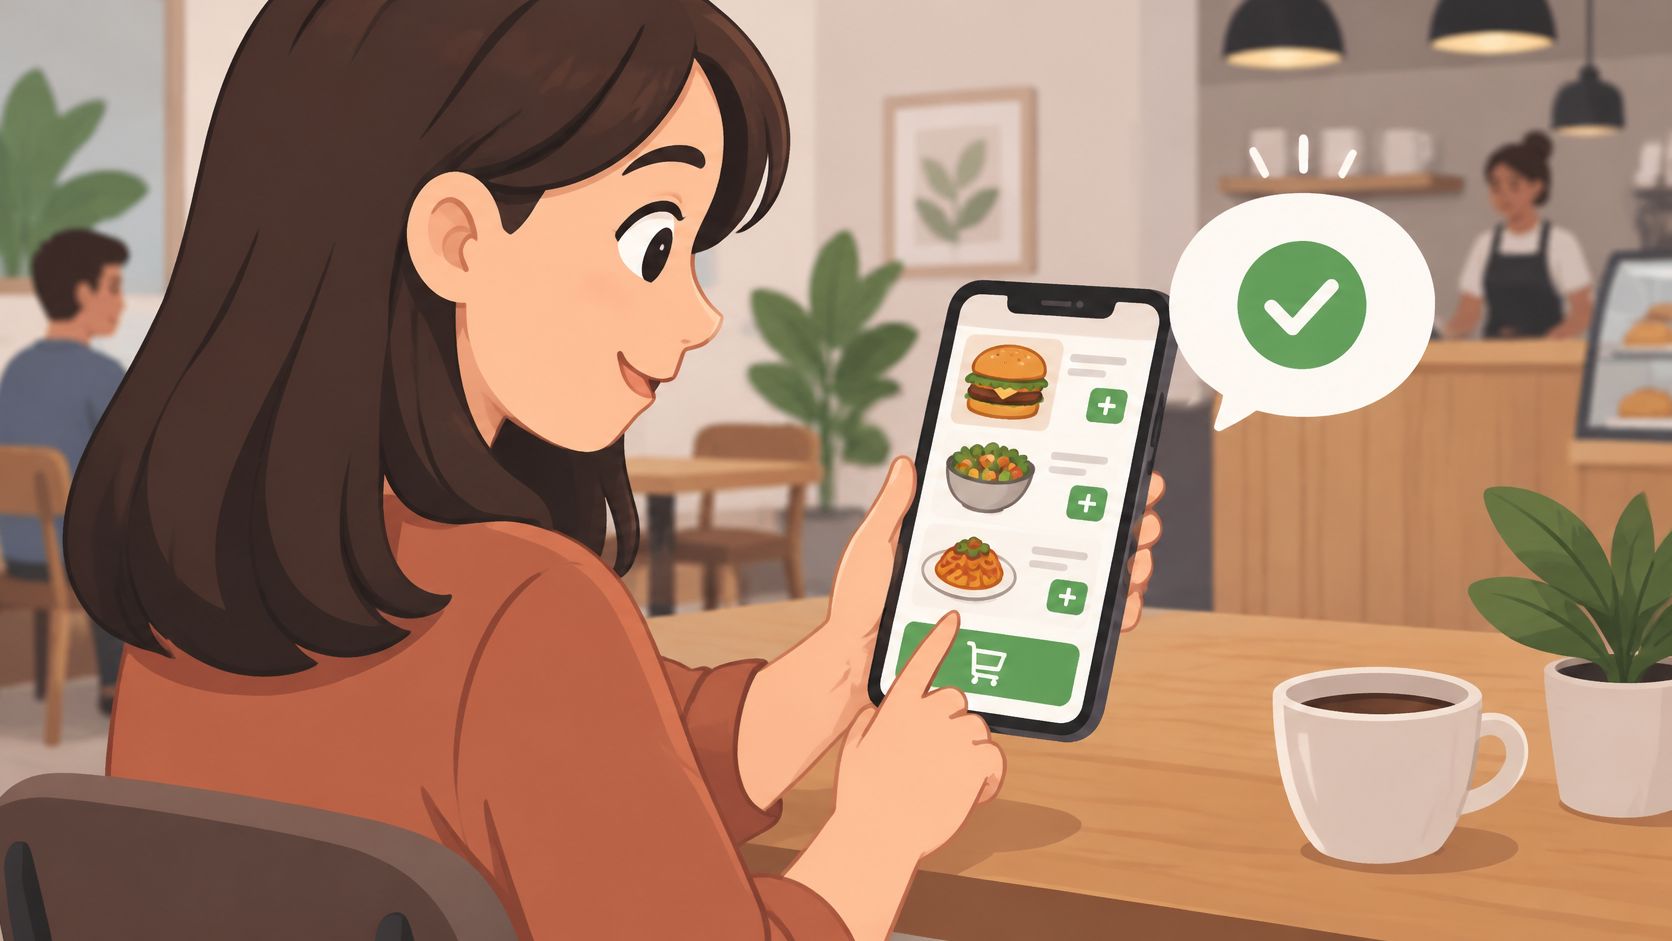
A coffee shop can ask, right after an in-app purchase, how easy it was to customize the drink, discovering that the milk or syrup selection step is confusing. A restaurant can measure how easy it was to change a reservation via WhatsApp and see that time slots aren't updating. In a store, the same logic asks whether getting an invoice required insisting.
One task per survey: ordering, paying, booking, or changing a reservation. Not all four at once.
Modifiers: use it when oat milk, sugar-free options, or a haircut with a reference photo was involved.
Short open-ended field: only to pinpoint the click or the counter where the customer hit a snag.
A low CES alongside a high CSAT is a warning sign for repeat business. The customer enjoyed the final result, yet still had to struggle with the process.
4. Attribute-Based Questions for Restaurants on Flavor, Temperature, and Accuracy
A high overall score can coexist with weak underlying attributes. Across six restaurants in Ciudad Hidalgo, Michoacán, a 22-item SERVQUAL questionnaire showed that the tangible dimension—facilities, decor, temperature/climate, hygiene, location, and extra services—had an average satisfaction rate of 42%, with overall quality and service around 44%. Even so, when asked for a score from 1 to 10, about 70% rated between 8 and 10, and in five of the six locations between 70% and 80% fell into that range, according to the study by Pistas Educativas.
A score of 9 does not tell you if the steak arrived lukewarm or if the custom-modified order came out wrong.
That's why a restaurant must separate flavor, temperature, portion size, and accuracy with modifiers. Three or four attributes per visit are plenty. The question about modifiers should only appear if the customer selected one. That way, someone who ordered directly off the menu isn't penalized.
Where to Look in the Kitchen
A restaurant that sees low scores in entree temperatures can inspect pass times rather than the server's greeting. A coffee shop that asks about order accuracy usually finds the error in syrups and alternative milks, not the base espresso. Reviewing by dish, rather than by "the food," reveals which recipe or portion size to adjust.
Cleanliness and atmosphere, kept separate: don't roll them into the same flavor star rating.
Order accuracy: ask whether what arrived matched what was ordered, including extras and dietary restrictions.
Small incentive: a dessert or a discount on the next visit boosts response rates without turning the survey into a giveaway.
This separation is what enables targeted recovery campaigns based on root causes, rather than a generic coupon for everyone.
5. Questions About Wait Time and Service Speed
The customer's clock and the kitchen's clock rarely match. Asking "Was the service fast?" is too vague. Better: "How many minutes did you actually wait?" and "Was the time between ordering and delivery appropriate?", using the same 1 to 5 scale across all locations.
In La Paz, Baja California Sur, the EMCASER scale—validated for Mexican restaurants—used 165 surveys between October 2024 and January 2025 covering food, facilities, convenience, safety, and atmosphere. There were significant variations in convenience and assurance, and both correlated with the intention to recommend, alongside food and atmosphere, according to the instrument from TecNM. Convenience here is operational: wait times, dish modifications, clarity of the check, and resolving issues without customer insistence.
Actual Minutes vs. Perception

A coffee shop that sees speed drop between 8 and 10 a.m. doesn't need another slogan. It needs more hands on deck during that window. A restaurant can cross-reference wait-time perception with POS kitchen ticket times and reorganize the pass. How to configure the bar and kitchen to shave off that extra minute is detailed in this guide on serving faster.
Breakdown by time slot: the daily average hides the peak rush.
Clear check: ask if the billing was correct, because a wait at the cash register is friction too.
Informed team: share which time slots concentrate complaints, not a leaderboard of blame.
In the CRM, those responses are segmented by location, time slot, channel, and whether the order included modifications. The 9 a.m. problem isn't fixed with the same message used for dinner service.
6. Questions for Convenience Stores and Shops on Assortment, Checkout, and Service
In a store, the customer judges three things, and blending them together ruins the diagnosis. Did they find what they were looking for? Did the checkout line move fast? Did the service feel attentive? Pricing and friendliness do not belong in the same question.
Measure the purchase, not "the store in general." The store average masks the shift or register that needs support.
A store that rates assortment and checkout speed on a 1 to 5 scale can see that complaints cluster when a fast-moving product runs out midweek. Another, after feedback about the line, opens a second register at the after-work rush. The survey goes on the receipt or on a QR code next to the register, while the purchase is still fresh.
Short scale: 1 to 5 plus an optional open-ended question, not an HR questionnaire.
By shift and register: a slow line is not the same as an out-of-stock product.
Price kept separate: billing clarity and fairness in their own question, so they don't distort service ratings.
The same logic applies to takeout and delivery orders, but there the customer judges three other things.
7. Questions for Takeout and Delivery Orders on Accuracy, Packaging, and Temperature
With a delivery order, the visit doesn't end when the food leaves the kitchen. It includes order taking, packaging, delivery time, and whether what was ordered actually arrived. Lumping all of that into "How was the service?" generates complaints that no one can assign.
In 2019, a Mexican customer experience study rated restaurants and fast food at 8.1 out of 10, matching the average across analyzed industries, with 1.2% growth compared to 2018. Perceived value for price, loyalty, and NPS remained below the overall cross-industry average, according to the brand report by KPMG. The same report notes that coffee shops and delivery services scored better than restaurant chains. The lesson applies to takeout: the overall score can look healthy while perceived price and return intent are suffering. They must be separated.
Three Checkpoints and One for Pricing
A restaurant can ask whether the order arrived complete and discover that extras and modifiers are what gets forgotten most. Another can send the survey one hour after delivery to hear how the food arrived, not just how it left the kitchen. The packaging question covers spills and presentation. The temperature question covers delivery times, without blaming the driver for what happened in the kitchen.
Against the receipt: "Did everything you ordered arrive?", not "Did you like it?".
No extra data: nothing that asks for information the business won't use.
By channel and dish: app, phone, and counter do not share the same average.
Subtle commercial use: the answer can trigger a recovery coupon, provided there was consent for WhatsApp or email.
This segmentation is what turns a packaging complaint into a process fix, rather than a blanket discount sent to the entire customer base.
8. Open-Ended Questions and Return Intent in Coffee Shops and Foodservice
Scales tell you how much. The open-ended question tells you what. A single one is enough: "What is one thing you would improve?". The second, behavioral question is: "How likely are you to return in the next two weeks?". Together, they distinguish between a customer who is satisfied but won't return and one who has formed a habit.
In a survey of 134 customers of restaurants and small dining businesses in Mexico, positive ratings for products were 61.2% at one regional venue and 64.2% at another. Service stood at 64.2% and 53.7%, and experience at 64.2% and 59.7%. Between 76.1% and 77.6% visited one to three times a month, most did not receive complimentary items, and respondents suggested loyalty promotions for frequent guests, according to the article in Redalyc. For a coffee shop, that justifies separate questions for flavor, service, fair pricing, visit frequency, and reward appeal.
From an Isolated Comment to a Segment
A coffee shop that asks what to improve and receives multiple mentions of dairy-free options now has a menu decision, not a vague opinion. A food business that asks if the customer would return within two weeks and cross-references that with actual purchases sees who followed through. How to convert a first visit into a second is explored in this article on getting customers to return.
One open question: categorize it under service, product, price, or atmosphere. Don't ask for three paragraphs.
Intent vs. repurchase: the promise of returning is not an actual visit. Compare it with real frequency.
Visible follow-through: respond to recurring comments. Silence signals that the survey was just for show.
In your CRM, low satisfaction combined with high recurrence is a top priority for recovery. High satisfaction and frequent visits make a customer a candidate for loyalty points or an invitation to review, not the same old apology coupon.
Comparison of 8 Survey Question Types for Restaurant Satisfaction
Method or Question Type | Implementation Complexity | Required Resources | Expected Outcome | Ideal Use Case | Key Advantage |
|---|---|---|---|---|---|
NPS: Likelihood to Recommend | Low | 0-10 survey and tracking by period or location | Loyalty and recommendation indicator | Tracking trends across restaurants, coffee shops, and stores | Easy to benchmark across periods and locations |
CSAT: Visit Satisfaction | Low | Short 1-5 survey, stars, or smiley faces | Satisfaction with a specific visit | Detecting changes by shift, service type, or location | Quick to answer and easy to interpret |
CES: Task Ease | Low to Medium | Post-order, post-payment, or post-booking survey | Level of effort and process friction | Improving apps, payments, ordering, and reservations | Pinpoints concrete operational bottlenecks |
Product Attribute Questions | Medium | Short survey with dish and modifier tracking | Specific issues with flavor, temperature, portion, or accuracy | Restaurants with customizable dishes | Highlights which product or process needs adjustment |
Wait Time and Speed Questions | Medium | Survey by time slot and, if possible, POS data | Perceived wait times and potential bottlenecks | Coffee shops and restaurants with peak hours | Helps adjust staffing levels and prep work |
Convenience Store and Shop Questions | Medium | Receipt or QR survey tracking shift and register | Evaluation of assortment, checkout speed, and service | Stores with several registers or shifts | Identifies issues by shift and register |
Takeout and Delivery Questions | Medium | Post-delivery survey tracking channel and order | Evaluation of accuracy, packaging, and temperature | Restaurants with takeout or delivery orders | Compares what arrived with what was ordered |
Open-Ended and Return Intent Questions | Medium | Open-ended question, defined timeframe, and feedback analysis | Improvement ideas and stated intent to return | Coffee shops and food & beverage businesses | Uncovers needs that closed-ended questions miss |
Turn Responses into Visits with a Short Template and Follow-Up
Four questions cover on-premise, WhatsApp, and email in under a minute. First, CSAT from 1 to 5 on today's visit. Second, an attribute tailored to the industry: flavor and accuracy in a restaurant or coffee shop, assortment and checkout speed in a store, or accuracy and temperature in a delivery order. Third, NPS from 0 to 10 or likelihood of returning within 30 days—never both in the same send if the form is already lengthy. Fourth, an open-ended question only if the score was low, or a single improvement suggestion if the business wants ideas for menu and atmosphere.
The survey goes out upon closing the visit or delivery, via QR code, WhatsApp, or a link on the receipt. Six to eight items is the hard ceiling when rotating attributes. More text drives down completion rates and blurs root causes. Each response records location, date, channel, and visit type so the dashboard doesn't serve up a blind average.
Breaking down food, service, atmosphere, and overall experience helps, but it is not enough. The survey should inquire about subsequent behavior: whether they would return to the location, leave a review, what aspect they would highlight, and what incentive would make sense—be it loyalty points, a drink, dessert, or a discount. Satisfaction and recommendation are not the same thing. A customer can leave happy without ever posting a word.
If phone numbers, WhatsApp, or emails are requested, the business must explain how they will be used and obtain consent. Applicable Mexican regulations mandate transparency and consent for personal data processing by private entities. Without it, customer follow-up becomes a liability rather than a retention opportunity.
In your CRM, a low rating paired with a high ticket or frequent visits triggers an automated recovery message in under 48 hours. A high rating and monthly recurrence open the door to loyalty points, a beverage, or an invitation to leave a review. Swirvle centralizes these responses, ties them to customer profiles and receipts, and allows you to automate detractor follow-ups while tracking recurrence and average ticket in the same place. The same logic categorizes coupons by root cause: cold food, long wait, billing error, or incomplete order—never a one-size-fits-all discount.
The form can't be a dead end. The survey, consent, and reward must live in the same seamless flow. Otherwise, the business just collects opinions without knowing who actually returned.
Swirvle delivers a CRM with an integrated loyalty program for restaurants, coffee shops, and stores looking to connect survey feedback to the customer, location, and receipt. With that connection, you can segment detractors, send follow-ups via WhatsApp (on the Premium plan), and measure repeat visits and average check sizes without messy spreadsheets. Explore how to set up this workflow at Swirvle.
Related Blogs

Oct 24, 2026
What questions should you ask in a restaurant satisfaction survey? 8 ideas

Oct 23, 2026
Is it legal to charge a card payment fee in Mexico?

Oct 22, 2026
How to prevent employee petty theft in my business?

Oct 21, 2026
How to Control Food Waste in a Restaurant: 2026 Guide

Oct 20, 2026
What is the global invoice for the general public and when is it issued? SAT Guide

Oct 19, 2026
How to take restaurant orders on WhatsApp without losing any?