
Learn how to calculate dish selling prices step by step: ingredients, indirect costs, VAT, margin, and real examples for your small business.
Raising the price of a dish does not automatically fix a poorly costed business. That is the most frequently repeated and also one of the most dangerous recommendations: if the calculation ignores rent, gas, labor, waste, and VAT, the owner can charge more and continue to subsidize each order. The correct way to understand how to calculate the selling price of dishes is to build three separate references: the price without VAT to control the business, the price with VAT for the menu, and the promotional price to sell with intention, not desperation.
The method starts with a standardized recipe, exact quantities, real yield, and cost per serving. It then incorporates food cost, indirect costs, waste, and desired profit. In Mexico, costing guides usually place operating food cost between 25% and 35%, while exceeding 38% is already a warning sign for profitability, according to this Mexican guide for calculating restaurant costs.
Why raising the price does not always fix the margin
“Just raise the price” fails because the selling price alone does not reveal profit. A dish with ingredients costing $45 sold for $110 seems to leave a 59% margin if only raw material cost is compared with the price. But the business still has to absorb $22 in rent, electricity, and labor, plus the 16% VAT, leaving the real profit below $15. These figures illustrate the calculation error, not a universal rule, because every business has a different structure.
Owners who use simplified calculations often make wrong decisions. They buy more inventory, hire staff, or open a second location because the menu appears to be making money. In reality, some dishes are financing costs that others do not cover.
Rule of thumb: before raising the price, reconstruct the complete cost of the dish. Only then will you know if it is best to adjust the rate, reduce the portion, or renegotiate with the supplier.
Concept | Simplified calculation | Complete calculation |
|---|---|---|
Price charged | $110 | $110 |
Ingredients | $45 | $45 |
Apparent margin | $65, equivalent to 59% of the price | Does not represent final profit |
Rent, electricity, and labor | Not considered | $22 |
VAT | Not separated | 16% of the public price |
Approximate profit | $65 apparent | Less than $15 |
Price is born from real cost
Pressure on supplies makes this control mandatory. Canirac has pointed out increases in operating costs of 15% to 18% for supplies, and increases exceeding 30% have also been documented in products for preparing dishes, with peaks of up to 40% in beef, dairy, vegetables, tomatoes, and avocados, as detailed in this restaurant finance guide in Mexico.
This means that a recipe that is profitable in January may cease to be so after several supplier changes. The price must not chase the competition. It must respond to updated costs, perceived value, and the customer's ability to pay.
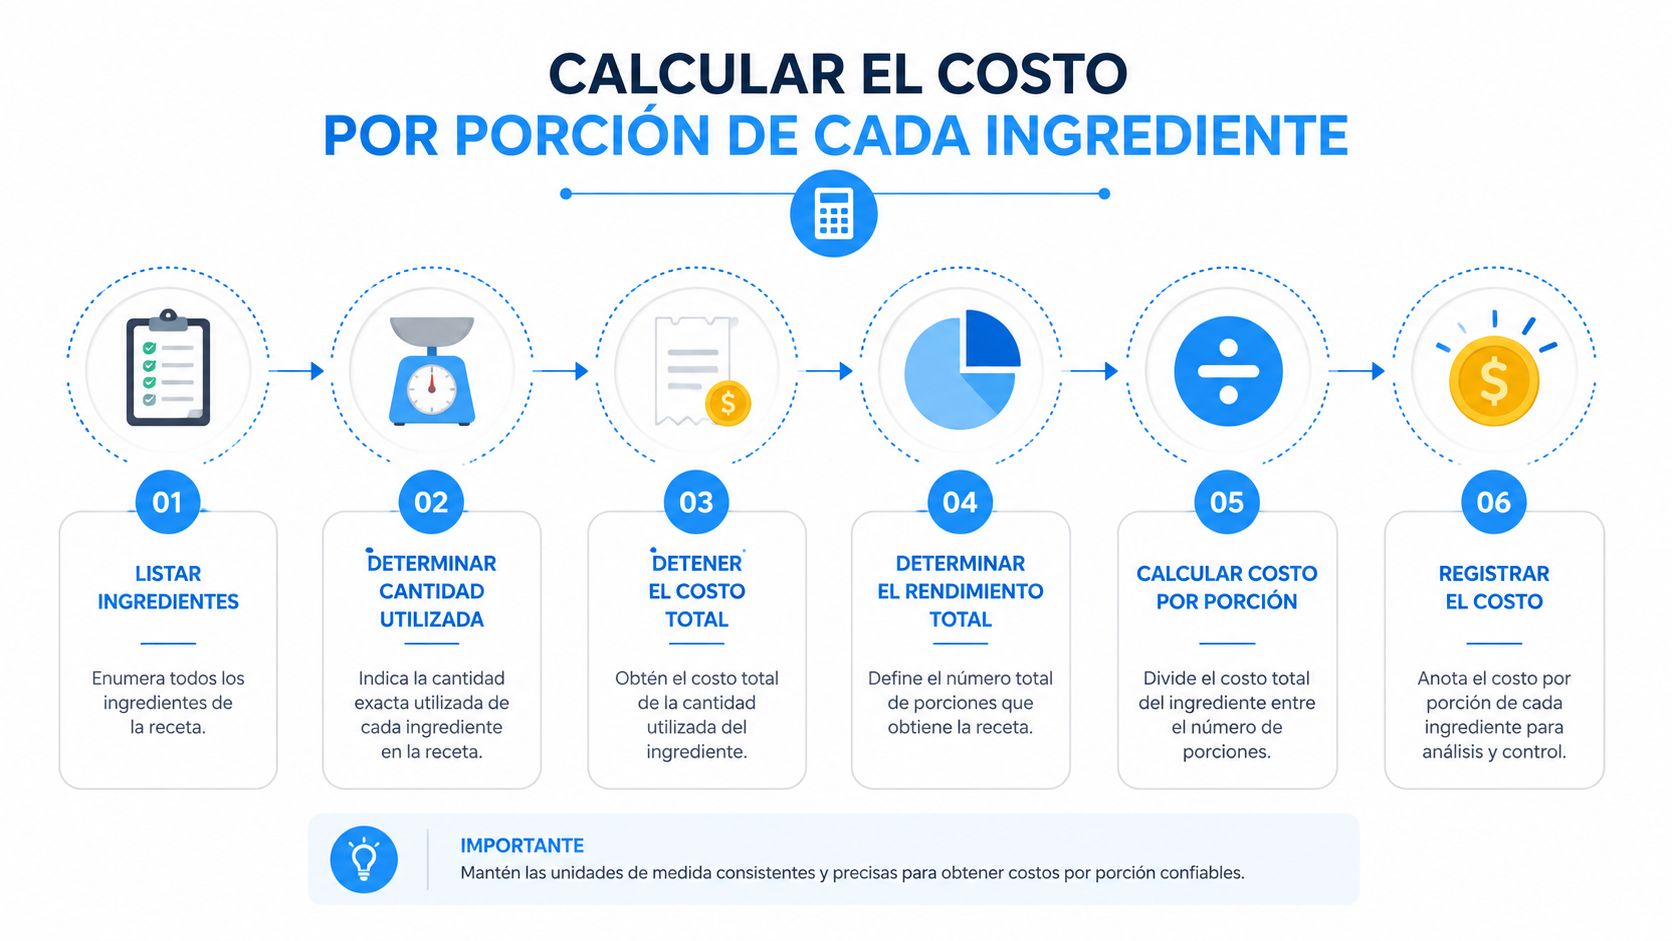
Calculate the cost per serving of each ingredient
The first task is to transform the purchase price into the served cost. Milk is bought by the liter, coffee by the kilo, flank steak by the kilo, and sauces by the container, but the customer consumes milliliters, grams, or pieces. Without this conversion, the recipe costing sheet remains incomplete.
The recipe must record raw weight, cleaning waste, cooking loss, and the net quantity that reaches the plate. A kilo of flank steak does not yield a served kilo. Part is trimmed, part loses moisture, and another part can end up as waste.
The procedure that avoids errors
Record the purchase. Note presentation, quantity purchased, and unit price. For example, milk at $28 per liter.
Measure yield. If that milk has a yield of 95%, the useful cost must consider only the usable amount.
Weigh the portion. A latte may use 30 ml of milk, in addition to coffee, sugar, cup, and lid.
Sum each component. The disposable cup, lid, syrup, and napkins are also part of the direct cost.
The operational formula is:
Cost per serving = (purchased weight × yield) ÷ grams of portion × price per kilo
For liquids, the same logic is adapted to liters and milliliters. With milk at $28 per liter, a yield of 95%, and a portion of 30 ml, the approximate cost of the milk is $0.85.
Two recipes, two controls
In a latte, the sheet must include coffee, milk, sugar, cup, and lid. In an entree, a flank steak needs to register the meat, the side dish, tortillas, sauces, and any accompaniment included at no visible cost to the customer.
Supply | Purchase unit | Necessary control | Result |
|---|---|---|---|
Milk | Liter | Yield and milliliters served | Cost per drink |
Coffee | Kilo | Grams used per extraction | Cost per cup |
Flank steak | Kilo | Trimming, cooking, and grams served | Cost per plate |
Side dish | Preparation | Yield of the complete recipe | Cost per serving |
Cup and lid | Piece | Count per drink | Packaging cost |
Oil should not be charged in full to a single order if it is reused in a controlled manner. Spices cannot be left out just because they are added "by the handful" either. The kitchen manager must weigh the quantities or define a standard measure.
To document quantities, yields, and substitutions, it is advisable to maintain a standardized recipe for restaurants. This discipline allows updating the cost when a supplier, a side dish, or the portion size changes.
Apply the food cost formula and set the target margin
Food cost answers a specific question: what part of the selling price does raw material represent. The formula is:
Food cost % = (cost of ingredients ÷ selling price) × 100
If ingredients cost $50 and the price is $150, the food cost is 33%. The inverse relationship serves to set the price:
Selling price = portion cost ÷ desired food cost
With a cost of $50 and a target of 33%, the suggested price is approximately $150. That same result can be expressed as an implicit 3x markup on raw materials, a practical reference for certain high-turnover dishes.
Technical guides for restaurants in Mexico usually consider a food cost of 25% to 35% to be healthy. A technical guide for recipe costing classifies a result of less than 30% as excellent, 30% to 35% as acceptable, and higher than 35% as an alert. The operating range of 28% to 35% works as a useful reference for decision-making, but it does not replace analyzing the entire business.
Food cost | Interpretation | Example: cost $50 | Suggested price |
|---|---|---|---|
25% | Very demanding for raw materials | $50 ÷ 0.25 | $200 |
30% | Solid target | $50 ÷ 0.30 | Approximately $167 |
33% | Balanced reference | $50 ÷ 0.33 | Approximately $150 |
35% | Frequent operating limit | $50 ÷ 0.35 | Approximately $143 |
More than 38% | Risk zone | $50 ÷ 0.38 | Approximately $132 |
Food cost is not profit
Food cost only measures ingredients. It does not cover VAT, salaries, rent, gas, maintenance, delivery platforms, packaging, or administration. Using it as the sole benchmark is the error that separates an apparently profitable recipe from a business that does not generate cash.
A dish with expensive ingredients can be sustained if it attracts complementary orders, such as drinks or desserts. Conversely, a cheap dish can be bad for business if it requires too much preparation time, occupies equipment, or generates a lot of waste. The type of product also matters: an appetizer, a drink, and an entree do not have to pursue the same target.
The formula should inform a decision, not replace it. Raw materials between 33% and 47% of the selling price appear as a practical criterion for restaurants, while a more complete formula adds raw materials, labor, indirect costs, and desired profit, as explained by Unilever Food Solutions regarding dish costing.
Add labor, indirect costs, and real waste
The cost of ingredients is only the first layer. A coffee shop can buy good coffee and still lose money if it does not distribute rent, electricity, gas, salaries, and waste among what it sells. Allocation does not need to be perfect from day one, but it must be consistent.
Monthly allocation
The practical procedure has three steps:
Sum monthly costs. In a coffee shop example, rent is $18,000, electricity is $3,500, gas is $2,200, salaries are $24,000, and other costs are $4,300. The total is $52,000.
Divide by units sold. If 1,300 dishes are sold per month, the assigned indirect cost is $40 per dish.
Add it to the cost of ingredients. A dish with ingredients of $38 starts with a combined cost of $78 before applying profit and corresponding taxes.
Concept | Monthly amount (MXN) | Cost per dish (MXN) |
|---|---|---|
Rent | $18,000 | Part of allocation |
Electricity | $3,500 | Part of allocation |
Gas | $2,200 | Part of allocation |
Salaries | $24,000 | Part of allocation |
Other costs | $4,300 | Part of allocation |
Total | $52,000 | $40 |
The industry's expense structure confirms why looking at the pantry is not enough. The INEGI economic census document reports that expenses account for 71.7% of total expenses in this industry, a figure that reinforces the need to include indirect costs.
Waste, labor, and responsibility
Rotten vegetables, dried-out meat, and expired sauces must be measured using purchase and waste records. Real waste can be managed as a percentage of purchases, with a typical reference of 5% to 8%, but the business must replace that reference with its own history as it accumulates data.
The owner also works, even if they do not receive a paycheck. If they prepare orders, purchase supplies, or supervise the kitchen, that time has a cost. Omitting it produces an artificially low price and makes the business appear profitable only because the owner absorbs labor without accounting for it.
The minimal formula is as follows:
Total cost = ingredients + indirect costs + waste
Control over entries, exits, inventory, and waste should be maintained in a restaurant inventory record. Without this record, the waste percentage is just a guess.
Separate the price without VAT, with VAT, and promotional price
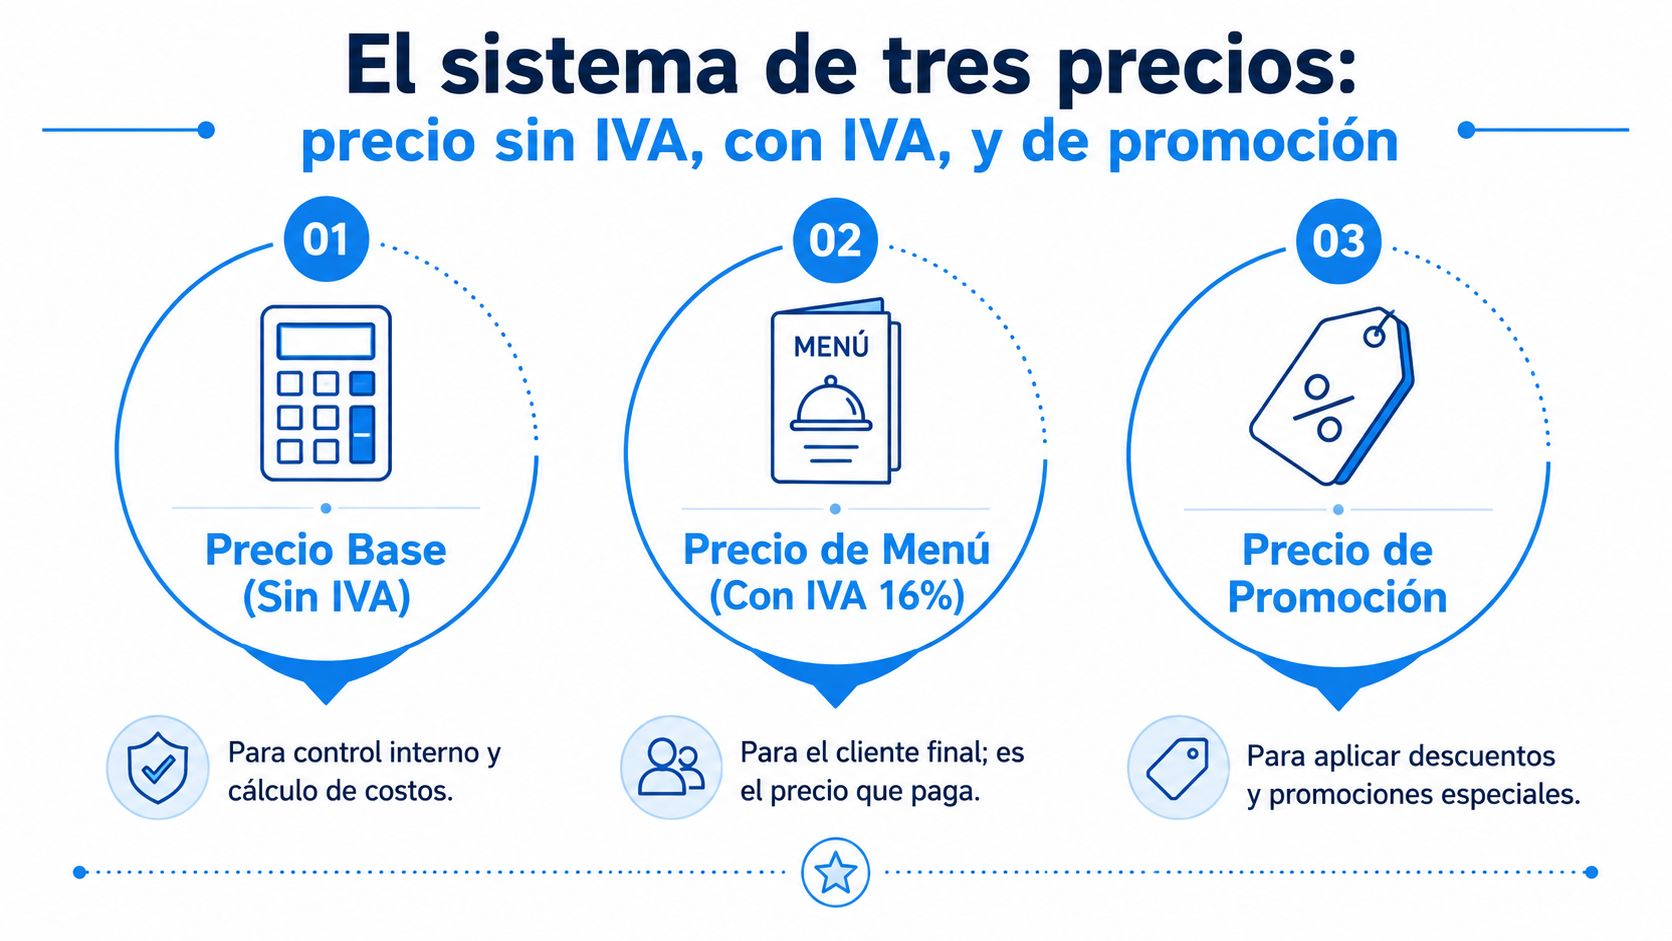
The price must live in three columns, not just one. The price without VAT serves to evaluate costs and margins. The price with VAT is what the customer sees on the menu. The promotional price exists for a specific campaign and should never be confused with the normal price.
With a total cost of $78 and a target food cost of 33%, the base price without VAT is approximately $236 using the ratio of total cost divided by the target. When adding 16% VAT, the menu price reaches approximately $274.
The complete formula is:
Menu price = (Total cost / (1 - target food cost)) × 1.16
In practice, this formula must be applied with discretion. If classic food cost is used on raw materials, the base price is obtained by dividing the relevant cost by the food cost. If full costs are incorporated, you must clearly define what part represents fixed cost, what part represents raw material, and what margin is sought. Mixing both formulas without distinguishing them generates inflated prices or deceptive margins.
Promotions must protect the margin
If the menu price is $274, a loyalty campaign with an 8% to 12% discount can bring the promotional price to approximately $244, depending on the selected percentage and rounding. This price should only be activated for a defined audience, schedule, or behavior.
Price without VAT: internal control, margin review, and recipe comparison.
Price with VAT: public rate for counter, physical menu, and customer communication.
Promotional price: limited incentive for frequent customers, volume, or low demand.
It is not advisable to give away cash discounts or pass them on without review to delivery platforms that charge additional commissions of 18% to 25%, according to the cost reference of the food cost and dish price calculator. The margin can break even if the food cost seems correct.
A well-designed “enchilada Tuesday” preserves the public price, offers the promotional price only within the loyalty program, and avoids adding a beverage or side dish whose cost has not been calculated. The price elasticity in restaurants should guide which product is discounted and which is kept as an anchor.
Examples by business type with real numbers
The same method changes according to turnover, average ticket, and the role the product plays. A neighborhood coffee shop needs to protect volume and recurrence. A diner faces a more complex preparation. A barbershop can use coffee as an amenity, not as a center of profitability.
Concept | Neighborhood coffee shop | Diner | Barbershop with coffee |
|---|---|---|---|
Operation | 40 coffees and 25 lunches daily | 80 dishes daily | Coffee included with the service |
Ingredient cost | $12 per latte | $42 per entree | $15 per coffee |
Indirect costs | $8 | $35 | $6 |
Specialized labor | Included in indirects | $18 | Associated mainly with the haircut |
Price without VAT | $56 | $190 | Not the main focus |
Price with VAT | $65 | $220 | $50 |
Target food cost | 30% | 35% | 60% as an amenity |
Product function | Recurring sale | Main source of income | Hook for the service |
In the coffee shop, the latte supports a target food cost of 30% because there is high repetition and complementary sales. The price without VAT of $56 and the public price of $65 must be kept separate in control and display.
In the diner, the entree carries ingredients, indirects, and specialized labor. The price without VAT of $190 and the price with VAT of $220 show that a lower-turnover operation needs more room to cover complexity.
The product is not always the business
The coffee at the barbershop plays a different role. It can be sold with VAT at $50, but it works as an amenity to improve the experience and encourage booking the haircut. A target food cost of 60% can be acceptable for this amenity if the main service generates profitability.
The average ticket defines how much margin each component can support. Appetizers, drinks, desserts, sides, and modifiers can subsidize or sink the result of the entire ticket. Therefore, the analysis must not stop at the isolated dish. One must observe the order mix and how often each customer adds products.
Validate and optimize prices with customer data
A price calculated on a spreadsheet is not yet validated. The market confirms it when the customer pays it, returns, and adds products without the business having to compensate with permanent discounts.
Tracking can be organized for 30 days with three weekly metrics: average ticket, repurchase frequency, and conversion of each new modifier or combo. Swirvle can segment customers by consumption habits and distinguish those who repurchase every 14 days as a control group and those who do so every 30 days as a test group.
A simple experiment
Two similar dishes can be tested for two weeks, one at $135 and another at $149. The comparison should observe units sold, average ticket, repurchase, and order composition, not just which price receives more orders.
The tracking sheet can use these columns:
Date: day of sale.
Dish: exact recipe and size.
Displayed price: public or promotional rate.
Units sold: quantity actually paid for.
Average daily ticket: average revenue per order.
Week | Action | Key metric | Decision criteria |
|---|---|---|---|
1 | Confirm recipes, yields, and costs | Cost per serving | Correct any omitted ingredient |
2 | Publish the three prices correctly | Average ticket | Separate internal control, menu, and promotion |
3 | Test prices of $135 and $149 | Units and repurchase | Keep the price that best sustains volume |
4 | Review combos and modifiers | Conversion and gross margin | Adjust the offer, do not give away discounts |
If the gross margin falls below 62% in a week, it is necessary to review the food cost and unrecorded costs, such as packaging, side dishes, or waste. If the volume drops more than 15%, it is advisable to adjust the price before changing the recipe. These rules work as internal alarms to make decisions based on data, not as universal statistics.
Inflation also limits customer tolerance. The CPI for restaurants and hotels reached 169.88 points in April 2026, while in July 2026 annual inflation was 6.28% in coffee shops and 5.83% in restaurants, above the general CPI, according to data cited in this price analysis of restaurants and coffee shops. The consumer already perceives increases, so the business must justify the price with consistency, portion size, service, and a well-targeted promotion.
Swirvle allows you to centralize customers, segment consumption habits, and execute loyalty campaigns with coupons, points, and rewards, while the business measures tickets and repurchases. To turn this three-price system into operational decisions, visit Swirvle and organize your next campaign with your margin protected.
Related Blogs

Oct 21, 2026
How to Control Food Waste in a Restaurant: 2026 Guide

Oct 20, 2026
What is the global invoice for the general public and when is it issued? SAT Guide

Oct 19, 2026
How to take restaurant orders on WhatsApp without losing any?

Oct 18, 2026
How to Create a WhatsApp Business Catalog to Sell More: 2026 Guide

Oct 17, 2026
How to set up quick replies in WhatsApp Business?

Oct 16, 2026
Can fake Google reviews be removed and how do you request it?