
Learn what Net Promoter Score (NPS) is, how to calculate it, and how to use it in your small business or brick-and-mortar store to turn detractors into promoters with real-world examples.
A coffee shop chain in Nuevo León may have good traffic, consistent tickets, and an operation that seems stable. Even so, something doesn't add up. There are customers who visit once, try the coffee, pay without issue, and never return. They don't complain at the register. They don't post anything online. They simply disappear.
That silence costs more than it seems because it leaves the owner operating blindly. The branch believes the service was correct, marketing believes the promotion worked, and the general manager only sees mixed sales. The real problem is that no one knows why some customers recommend the experience and others leave ready to switch brands at the next corner.
In Mexico, this information vacuum carries more weight because the experience no longer ends at the point of sale. The country closed 2023 with 66.4 million internet users, equivalent to 81.2% of the population aged 6 or older, and retail e-commerce reached 658.3 billion pesos with an annual growth of 24.6%, according to the context cited by Mouseflow's explanation of NPS. In a market like this, a single well-placed question helps detect promoters and detractors by branch, campaign, or segment.
When a physical business starts measuring this with discipline, it stops guessing. Net Promoter Score does not solve retention by itself, but it does provide the radar that many businesses have never had. And when that radar is combined with follow-up, recovery, and operational actions, it becomes much more useful than a decorative survey. For anyone currently looking for ways to recover lost customers, that difference matters.
Table of Contents
Introduction: Why Some Customers Do Not Return
A coffee shop owner usually detects the problem late. The bar keeps moving, orders go out, the team provides service, and the place looks full at certain hours. But when reviewing carefully, they discover that customer recurrence is not growing as it should and that some branches retain better than others for no obvious reason.
This also happens in car washes in Baja California, gas stations in the State of Mexico, or bakeries in Mexico City. The customer does not always complain in the moment. Sometimes they receive their order late, sometimes the drink is inconsistent, sometimes the experience was correct but nothing memorable. Without a simple measurement, all of that gets mixed into a vague perception of "it seems like we are doing well."
A customer who does not return almost never warns you. They just stop showing up.
The value of NPS starts right there. Not as a dashboard ornament, but as a way to listen to the experience while there is still time to act. In a business with multiple branches, that visibility changes the conversation. It is no longer about discussing if "the brand is feeling soft." It detects if the drop is coming from a specific store, a shift, a campaign, or a specific type of customer.
What is the Net Promoter Score NPS
The Net Promoter Score NPS became one of the most widely used metrics to measure customer loyalty. It was introduced in 2003 by Fred Reichheld along with Bain & Company and Satmetrix, and its structure led many companies to adopt it as an operational tracking standard, as summarized by IBM in its explanation of NPS.
The Question That Can Actually Be Operated
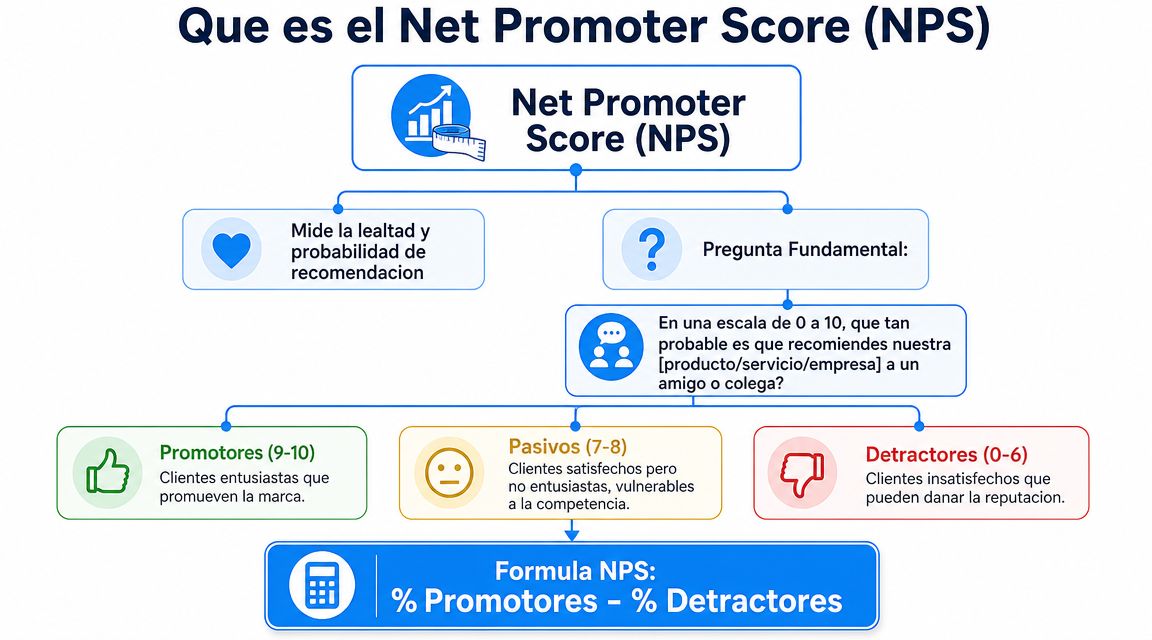
Its logic is direct. A single question is asked:
"On a scale of 0 to 10, how likely are you to recommend our brand to a friend or colleague?"
Based on that response, customers are classified into three groups:
Promoters: respond 9 or 10. They are customers with a high willingness to recommend.
Passives: respond 7 or 8. They were reasonably satisfied, but do not show strong loyalty.
Detractors: respond from 0 to 6. They are dissatisfied customers or those with enough friction not to recommend.
The strength of the method lies in its simplicity. A branch manager understands it quickly. An operations manager does too. And the owner can review the result without getting lost in complex indicators.
How It Is Calculated in Practice
The formula is just as simple:
% of promoters - % of detractors = NPS
Passives are neither added nor subtracted. They are simply left out of the final calculation. The result always falls between -100 and +100.
A practical example helps. Suppose a gas station in the State of Mexico sends its survey after a fill-up and then groups the responses. If a portion of the customers responded with 9 and 10, and another portion with 0 to 6, the NPS comes from subtracting those two percentages. This yields a single number that summarizes the relationship between customers who would recommend and customers who would not.
Rule of thumb: the number alone does not explain the problem. What it does very well is point out where it is worth investigating.
This makes NPS highly useful for physical businesses. It does not require complicated models. It allows comparing a branch in Monterrey against another in San Pedro, or a seasonal coffee campaign against a normal period, without losing operational speed.
How to Interpret Your NPS and Benchmarks for LATAM
The first question after calculating it is usually the same. Is that NPS good or bad? The short answer is that a positive result indicates more promoters than detractors. The useful answer is different. The number only makes sense when interpreted with operational context.
The Number Matters Less Than Its Context
For Mexican SMEs, it is best to read NPS as a variable linked to campaigns, customer service, and loyalty. The most cited reference in the literature of the method is that a score above 50 can be considered "excellent" and one above 80 can be considered "world-class", as Qualtrics explains when talking about NPS benchmarking. Even so, for a physical business in Mexico, the most useful comparison remains against its own history and against businesses in the same industry.
A coffee shop with several branches should not make major decisions just because "the overall NPS came out acceptable." If a unit in Puebla has comments about slowness, another in Yucatán receives complaints about consistency, and another in Nuevo León generates recurring promoters, the global average hides more than it reveals.
There are three comparisons that actually work:
Between branches: to detect real operational differences.
Over time: to see if a campaign, menu adjustment, or staffing change moved perception.
By segment: new vs. frequent customers, loyalty members, peak hours, or service channels.
Range Table for Operational Reading
The following table does not pretend to set a universal truth. It serves as a guide for quick reading in LATAM retail and services.
NPS Range | General Interpretation | Average Benchmark (Retail/Services LATAM) |
|---|---|---|
Less than 0 | There are more detractors than promoters. Clear sign of friction. | Below desirable levels |
0 to 49 | Functional result, but with obvious areas for improvement. | Common operational range |
50 to 80 | Excellent according to method benchmarking references | Strong performance |
Greater than 80 | World-class according to method references | Outstanding level |
A "good" NPS that falls month-over-month deserves more attention than a moderate NPS that consistently improves.
In small and medium chains, the trend rules. If a branch in a corporate neighborhood in Monterrey drops after changing the morning shift manager, that matters more than celebrating an aggregated average. The benchmark serves to orient you. Real management begins when the business compares its own operation in detail.
Questions and Templates to Collect NPS
Many businesses fail here. Not due to a lack of intention, but because they want to ask too many questions, request feedback at bad times, or send surveys that feel like administrative paperwork. If the collection is poorly designed, the NPS gets filled with noise.
The Short Survey Works Best
The basic structure should be kept simple:
Standard NPS Question: "On a scale of 0 to 10, how likely are you to recommend our coffee shop to a friend or colleague?"
Open-ended Follow-up Question: "What was the main reason for your score?"
The second question is usually the most valuable. That is where you find out if the problem was wait time, product temperature, cleanliness, staff attitude, billing errors, or a poorly managed expectation. In a coffee shop, the number alerts you. The comment explains it.
It is worth taking care of three practical decisions:
Timing of delivery: right after the visit or purchase, while the experience is still fresh.
The right channel: WhatsApp works well for businesses with frequent mobile interaction. Email can work for customers with more planned transactions or loyalty programs.
Controlled frequency: if you survey too much, the customer stops responding or answers in a rush.
If the business only collects scores and not reasons, it ends up with a traffic light. Not with a system for improvement.
Ready-to-Use Templates
WhatsApp Template for Coffee Shop "Thank you for visiting us today. On a scale of 0 to 10, how likely are you to recommend our coffee shop to a friend or colleague? Reply with a number. If you like, also tell us the main reason for your rating."
Email Template for Gas Station
Subject: Your experience at our station
Message: "We want to improve your experience. On a scale of 0 to 10, how likely are you to recommend our station to a friend or colleague? You can also reply to this email with the main reason for your rating."
QR on Ticket Template for Bakery "Scan and tell us on a scale of 0 to 10 how likely you are to recommend our branch. Your comment helps us improve."
Some cases require adjustments. A car wash can launch the survey shortly after the service. A high-flow coffee shop can rely on QRs on the ticket or table. A business with a loyalty program can trigger the message after registering the purchase. What matters is not the channel in isolation, but that the timing and format match the customer's habit.
Actionable Steps to Turn Detractors into Promoters
The most common mistake with NPS is treating it like a monthly report. That produces meetings. It does not produce retention. Value appears when the business uses feedback to intervene quickly and correct what is pushing the customer away from the brand.
The important question is not whether NPS reflects loyalty or just momentary satisfaction. The useful question is what operational changes or automated campaigns generate real repeat purchases based on that feedback, as proposed by Meegle when discussing the practical use of NPS. If there is no action, the score falls short. If there is follow-up, NPS starts moving business and increasing retention.
Closing the Loop Changes the Value of NPS
The practical process looks more like an operational routine than a marketing initiative.
A useful workflow for a coffee shop chain includes these steps:
Detect Quickly When a low rating comes in, the manager or supervisor must see it soon. Speed matters because the context is still fresh.
Read the Full Comment A 4 for "the coffee was lukewarm" is not resolved the same way as a 4 for "no one cleaned the table" or "I was billed incorrectly."
Respond with Context Follow-up should not sound robotic. It is best to acknowledge the problem and clarify that someone will look into what happened at that branch.
Correct the Cause Sometimes the problem requires compensation. Other times it demands training, shift adjustments, or reviewing the service flow.
Record the Pattern If several detractors mention the same thing, it is no longer an isolated incident. It is an operational issue.
Operations Tip: Not all detractors are asking for a freebie. Many just want to see that someone understood the mistake and took action.
What to Do with Each Type of Problem
Not all negative comments deserve the same response. Grouping them helps a lot.
Problem Type | What to Review | Immediate Action |
|---|---|---|
Slow service | Shifts, peak hours, checkout process | Adjust flow and follow up with the customer |
Inconsistent product | Recipe, preparation, training | Correct standards and validate in-store |
Poor customer service | Staff, supervision, tone of service | Coaching and personalized contact |
Confusing charge or promotion | Point of sale communication | Direct clarification and campaign correction |
A bakery in Mexico City might receive a poor rating due to a spoiled cake. The immediate problem is resolving it with the customer. The root problem might lie in display, temperature, or internal logistics. Therein lies the difference between putting out fires and learning.
Implement and Automate Your NPS Strategy with Swirvle
In businesses with multiple branches, manual measurement only works for a short time. Then the gaps appear. One branch sends surveys, another does not. One manager reviews comments, another leaves them for later. The result is an incomplete metric and disorganized actions.
What Actually Makes Sense to Automate
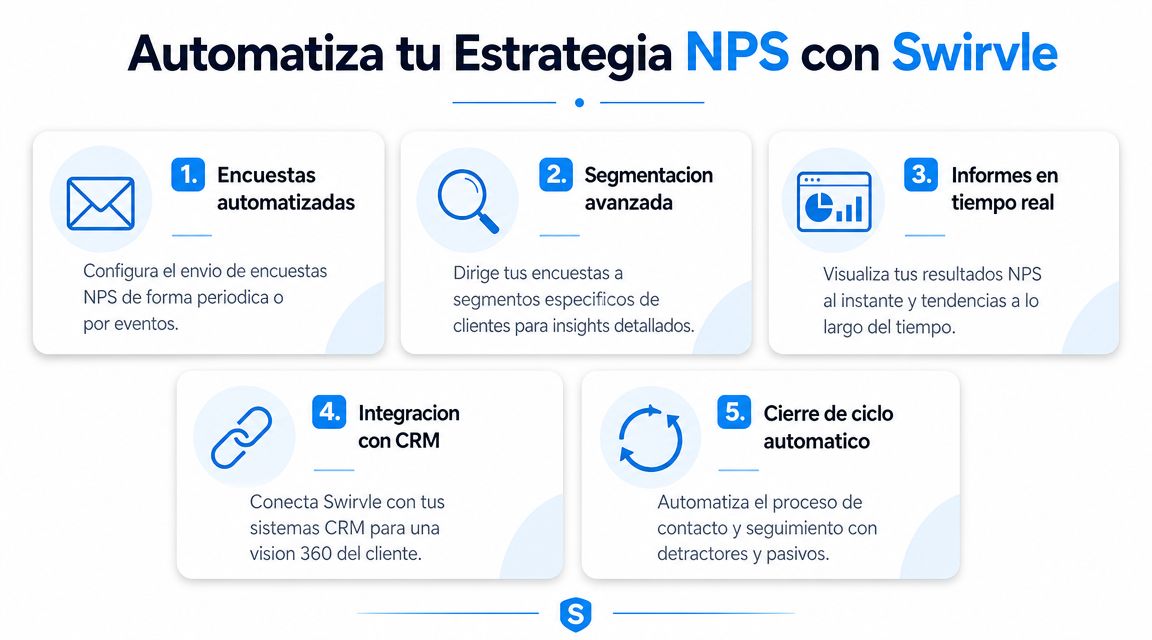
The repetitive part of the process must be taken out of the team's hands so they can focus on resolving issues, not chasing data. This includes:
Automated survey delivery: after purchase, visit, or reward redemption.
Detractor alerts: so the right person in charge sees the case without waiting for the end of the day.
Centralized response log: with history by customer, branch, and campaign.
Operational follow-up: tasks or recovery messages when a poor experience occurs.
A tool like Swirvle can run this type of flow because it centralizes customers, segments by consumption habits and branch, and allows triggering campaigns through channels like WhatsApp or email. For businesses that are still organizing their commercial data, it is also worth understanding what a CRM system is, because isolated NPS loses a lot of value if it is not connected with purchase history and recurrence.
Branch Segmentation Prevents Wrong Decisions
The real problem in physical businesses is usually not the general average, but the variation by point of sale. This is one of the most important questions in multi-branch operations: how to separate a low NPS due to poor branch execution from a low NPS due to poor customer segmentation. That nuance, highlighted in the analysis on grouping and comparing units, completely changes the management response.
A coffee shop in Nuevo León might have a lower NPS in a university branch and a higher one in a corporate branch. This does not automatically mean the first location operates worse. It may be serving a segment with different expectations, schedules, and visit patterns. Without segmentation, the owner punishes the wrong branch or copies practices that do not apply.
It is more useful to work with breakdowns like these:
By branch: to find execution differences.
By customer type: new, frequent, loyalty member.
By campaign: promotion, launch, coupon, or benefit.
By time slot: morning, lunch, afternoon, closing.
When NPS is crossed with branch and segment, it stops being just a score. It becomes a decision-making tool.
Automation also helps close the loop without relying on human memory. If a detractor comes in, the system can trigger a follow-up flow. If a promoter appears, the business can identify customers with higher affinity and take better care of them. That discipline frees up the team's time and improves consistency across stores.
Conclusion: NPS as a Growth Engine
Many owners view NPS as a reporting KPI. They calculate it, review it, and file it away. This approach leaves value on the table. NPS is much more useful when used as a system for listening, prioritizing, and taking action.
For a coffee shop chain, a car wash, or a gas station, the real utility is not in boasting a score. It lies in detecting which branch is failing, which type of customer is growing cold, which process is generating friction, and which changes increase the probability of a repeat purchase. That is where the Net Promoter Score NPS stops being an isolated metric and becomes a growth lever.
Anyone operating multiple branches in Mexico does not need more theory. They need to know why some customers return and others do not. They need to segment, respond quickly, and learn from every comment. When that work is automated and connected to operations and CRM, the business stops guessing and starts building loyalty intentionally.
If an SME with physical stores wants to turn feedback into retention, campaigns, and follow-up from a single place, Swirvle allows centralizing customers, segmenting by branch, and automating actions so that NPS does not remain just a number, but turns into decisions that actually impact customer frequency.
Related Blogs

Oct 16, 2026
Can fake Google reviews be removed and how do you request it?

Oct 15, 2026
What are WhatsApp Business labels used for and how do you use them?

Oct 14, 2026
How to do a cash register closure step-by-step in a small business?

Oct 13, 2026
How to respond to a negative Google review without losing customers: The BLUF Guide

Oct 12, 2026
What birthday promotions can a restaurant offer to make customers come back?

Oct 11, 2026
How to set up a WhatsApp loyalty program for my business?