Learn how to measure your business performance. Discover the essential success indicators for Mexican SMEs and boost your growth in 2026.
The scene is familiar to thousands of Mexican SMBs. The branch opens early, people walk in, the staff doesn't stop, the cash register shows activity, and at the end of the day, everything seems to be going well. But when the end of the month arrives, an uncomfortable doubt appears: if there was so much work, why isn't there a clear growth in the bank account?
That mismatch between activity and results is where success indicators stop being an office term and become a survival tool. A car wash in the State of Mexico can wash many cars and still lose profitability. A coffee shop in Puebla can be full in the morning and not know if its customers are coming back. A chain with branches in Yucatán and Baja California can sell well in total, but have one location dragging down the margin of all the others.
Measuring well changes the conversation. Decisions are no longer made by intuition, by "it feels slow" or by "this promo was very popular." Decisions are made with concrete signals that connect operation, customers, and money. For whoever runs a physical business, that means detecting which campaign did bring repeat purchases, which branch converts better, which channel generates higher-value customers, and which effort only keeps the team busy without leaving a profit.
Table of Contents
Is Your Business Growing or Just Busy? Measure What Matters
The right signal changes the decision
Occupancy is not growth
What Are Success Indicators or KPIs
The dashboard that actually matters
Vanity metric vs. actionable indicator
What a KPI must meet to be worthwhile
Key KPIs for Physical Businesses in Mexico
What changes according to the business type
Success indicators by business type
How to Set Goals and Calculate Your Indicators
A useful goal has a concrete shape
Simple formulas that actually work in operations
A simple operational example
From Data to Profits with Swirvle
Measuring manually slows down profitability
Measuring well works when the operation changes
Practical Cases of Automation and Improvement
Neighborhood coffee shop focused on recurrence
Car wash with reactivation by recency
Chain with branches that no longer compare blindly
Start Measuring Your Success Today
Is Your Business Growing or Just Busy? Measure What Matters
Having movement does not guarantee progress. A business can serve more customers, send more promotions, and post more on social media without improving its profitability. This mistake is common in coffee shops, restaurants, gas stations, and car washes where the operation consumes all of the owner's or manager's attention.
The problem is usually not a lack of effort. The problem is a lack of focus. When only gross sales are reviewed, very different things are mixed into a single figure: new customers, returning customers, impulse buys, aggressive discounts, and branches with opposing behaviors.
The right signal changes the decision
The success indicators serve to separate activity from real progress. If a coffee shop in Mexico City sells more this month, the useful question is not just how much it sold. The useful question is whether it sold more because its average ticket increased, because repeat visits grew, or because it sacrificed margin with promotions.
Practical rule: if a piece of data does not help decide what to do tomorrow, it is probably not a high-priority KPI.
A well-built dashboard helps answer very concrete questions:
Which branch converts better and which one is letting sales slip away.
Which campaign brings repeat purchases instead of just traffic.
Which segment buys with higher frequency and deserves more budget.
Which channel generates friction between interest and purchase.
Those who still operate on intuition end up reacting late. Those who review indicators detect patterns before they become a problem. To land that way of thinking, it is convenient to adopt a discipline of data-driven decision-making that connects daily operation with profitability.
Occupancy is not growth
A car wash in Nuevo León can have lines on Saturday and still be weak during the week. A retail franchise can celebrate high overall sales while one branch consumes inventory and staff without sustaining its own performance. A restaurant in Puebla can fill up with discounts, but lose value if those diners do not return.
Measuring what matters allows you to stop managing by feel. And when that happens, the business stops running all day without knowing if it is actually moving forward.
What Are Success Indicators or KPIs
KPI is not a complicated word. It is a piece of data that helps judge if the business is going in the right direction. The simplest way to understand it is to compare it to a car dashboard. The speedometer, fuel gauge, and temperature gauge do not exist to look pretty. They exist so the driver can make timely decisions.
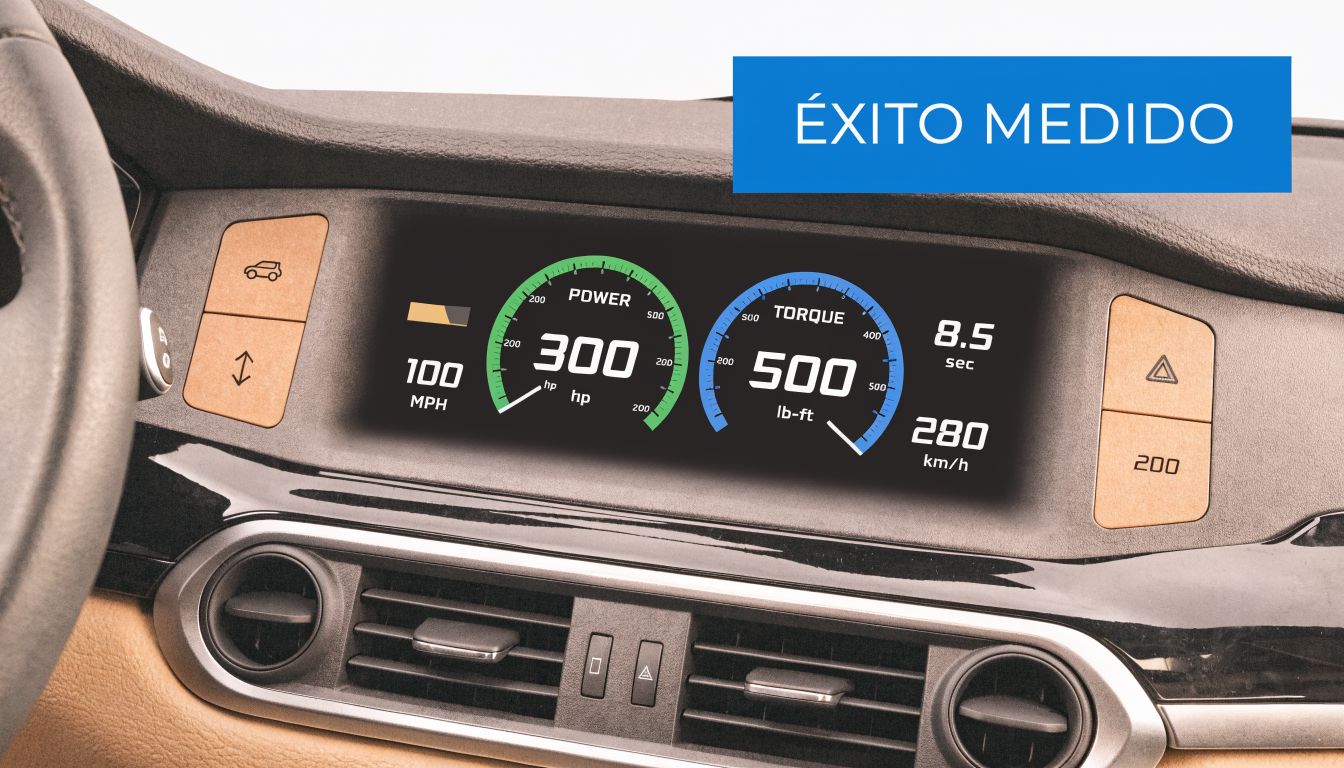
The dashboard that actually matters
In a physical business, that dashboard can include sales, average ticket, repeat purchases, prospect-to-customer conversion, or campaign return. Not all weigh the same. What is important is that each indicator answers an operational question.
If a branch receives many visits, that alone says little. In contrast, if you measure the conversion from visit to purchase, an actionable signal appears. Perhaps the problem lies with the staff, the offer, or the wait time.
A good KPI does not just describe. It forces you to correct, repeat, or scale an action.
In Mexico, companies that implement customer segmentation in their communications manage to increase their conversion rates by up to 20%, according to data on segmentation and automated marketing. That data is valuable because it connects a concrete indicator, the conversion rate, with a concrete action, segmentation.
Vanity metric vs. actionable indicator
This is where many businesses go astray. They confuse any number with a success indicator. A flashy figure is not the same as a useful figure.
It is useful to separate them like this:
Vanity metric: likes, general reach, visits without context, messages received.
Actionable indicator: conversion rate, purchase frequency, repeat purchases by branch, average ticket, recovered inactive customers.
A simple example makes it clear. A coffee shop in Roma can celebrate that many people opened a promotion on their phone. But if they don't measure how many people ended up buying and then returned, that campaign remains a blind bet.
What a KPI must meet to be worthwhile
There is no need to build a huge panel. You just need to choose well. An indicator is useful when it meets at least these conditions:
It is linked to money. Even if indirectly, it must drive sales, margin, or retention.
It can be broken down. It works by branch, by channel, or by customer type.
It allows you to act. If it changes, the team knows what to review.
It can be tracked over time. It is not an isolated snapshot.
When a business understands this difference, it stops chasing pretty numbers and starts operating with signals that actually drive results.
Key KPIs for Physical Businesses in Mexico
Not all businesses should look at the same dashboard. A gas station, a coffee shop, and a car wash share the challenge of selling more and retaining better, but the operational path changes. That is why success indicators must be chosen according to the type of consumption, the frequency of visits, and the ability to reactivate customers.
What changes according to the business type
In a coffee shop in Puebla, the critical data is usually in recurrence. If the customer buys once and does not return, the operation always depends on generating new traffic. In contrast, if they return regularly, each campaign works on a more profitable base.
In a franchise with branches in Yucatán and Baja California, the pain point is usually different. Corporate sees the consolidated figure, but needs to detect differences between locations. There, it matters to measure sales consistency by branch, conversion by local campaign, and promotion response by market.
The case of the car wash deserves separate attention. There is a critical gap in this sector in Mexico: despite having 27,947 establishments, there are no standardized indicators that connect visit frequency with net margins of 16.5%, according to Milenio's analysis on car washes and profitability. That leaves many SMBs without clear benchmarks to understand how retention impacts real profitability.
When a sector lacks clear references, measuring internally by customer, ticket, and recurrence is no longer an option. It becomes a competitive advantage.
For businesses that want to see practical examples of tracking by operation and branch, it helps to review these sales reports with examples, because they show how to translate data into concrete decisions.
Success indicators by business type
Business Type | Essential KPI | What Does It Measure Exactly? | Practical Example |
|---|---|---|---|
Coffee Shop | Visit frequency per customer | How often a customer returns in a period | A coffee shop in CDMX detects that morning customers return more than afternoon ones and adjusts its promotion |
Restaurant | Average ticket | How much, on average, each table or customer spends | A restaurant in Puebla discovers that a certain combo increases consumption without relying on a general discount |
Car Wash | Recency of visit | How much time has passed since the last purchase | A business in the State of Mexico identifies customers who stopped returning and triggers reminders |
Gas Station | Complementary purchase per visit | Whether the customer only fills up or also buys additional items | A station in Nuevo León reviews which shifts sell more complementary products |
Retail with branches | Sales consistency by branch | Operational differences between comparable locations | A chain in Baja California detects a store with good foot traffic but poor conversion |
Some patterns repeat. High-frequency businesses must watch recurrence and ticket size. Service businesses with multiple locations must watch consistency by branch. Those that rely on promotions must measure if those campaigns generate repeat purchases or just an isolated sale.
How to Set Goals and Calculate Your Indicators
Choosing a KPI is only half the work. The other half consists of setting a goal that helps you make decisions. Without a goal, the indicator is just observed. With a goal, the team knows what to correct and what to prioritize.
A useful goal has a concrete shape
Many SMBs formulate goals that sound good but do not help operate. "Sell more," "move more customers," or "improve marketing" tell nothing to the branch manager, the checkout team, or the campaign planner.
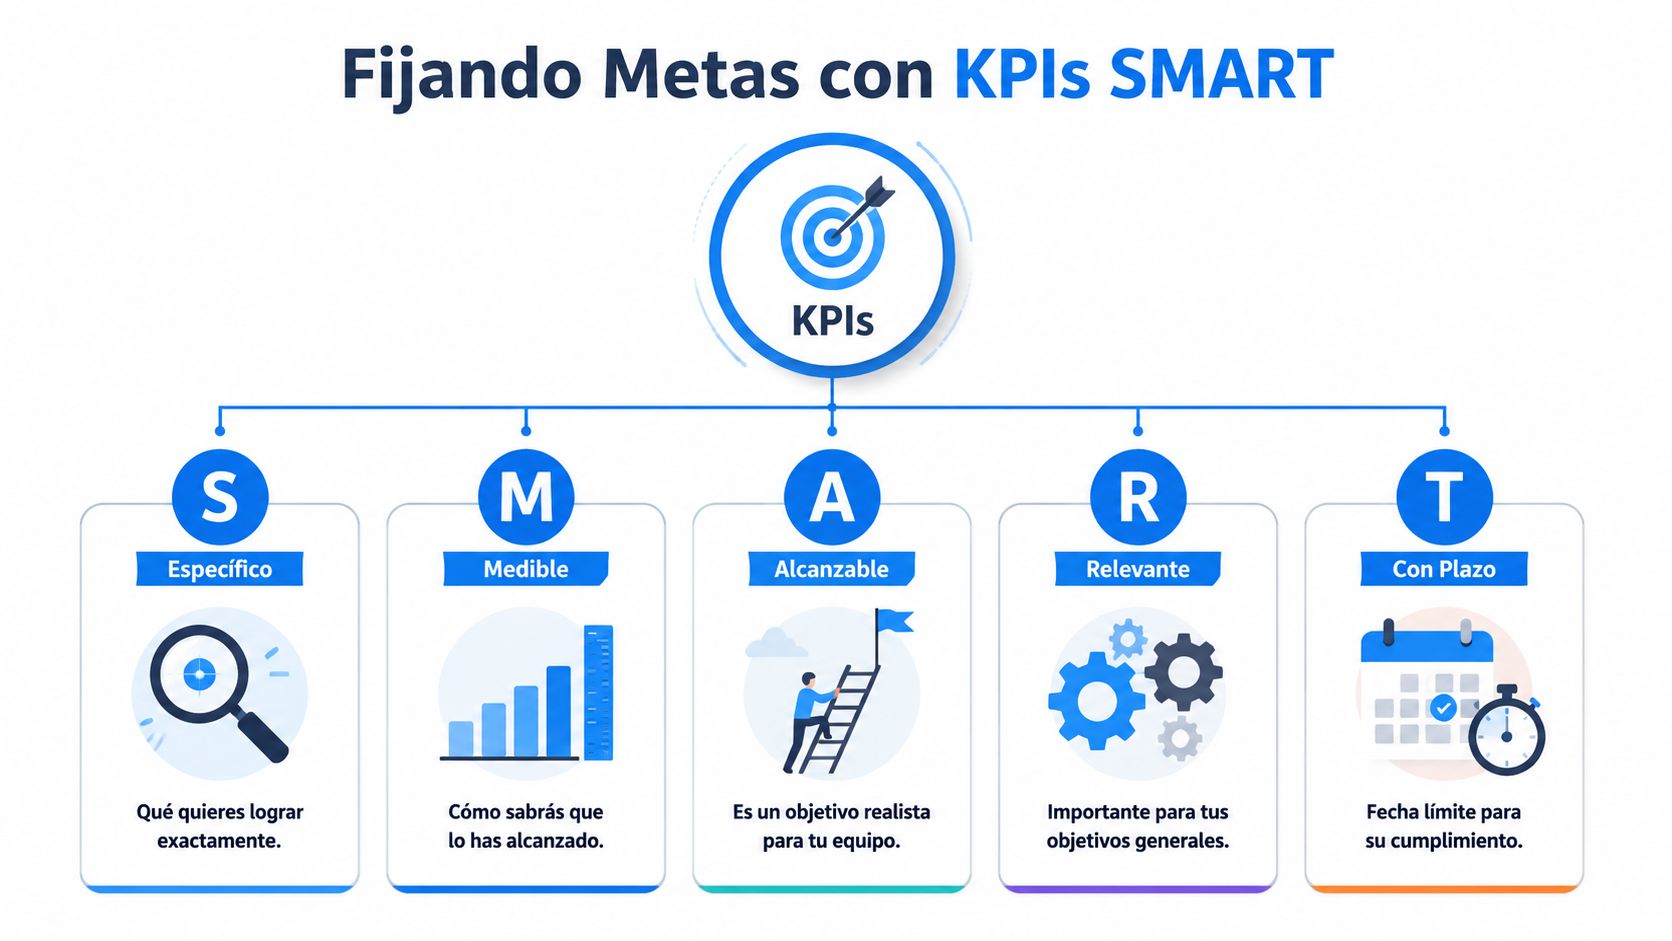
A useful goal must answer five questions: what needs to be moved, how it will be measured, if it is realistic, why it matters, and in what timeframe it must be met. This logic helps land decisions. Instead of "we want to grow," a coffee shop can work with "increase the average ticket in a specific branch during the next operating period."
For those who want to dive deeper into the relationship between goals and execution, this reading on goals and their strategic impact helps organize priorities without losing sight of the overall business.
The discipline changes when each goal is brought down to daily operations:
Specific: increase repeat purchases of inactive customers.
Measurable: review repeat purchases per customer or per cohort.
Achievable: choose a branch or segment before scaling.
Relevant: prioritize what impacts cash flow, not what just generates noise.
Time-bound: define weekly or monthly review.
Simple formulas that actually work in operations
Many owners postpone measurement because they think they need an analytical department. It's not true. Basic indicators can be calculated with very simple formulas.
Average ticket: total sales of the period ÷ number of purchases.
Purchase frequency: total number of purchases ÷ number of unique customers.
Retention rate: customers who return in the period ÷ customers of the base period.
Customer acquisition cost: commercial expenses of the period ÷ new customers acquired.
Conversion rate: customers who complete the target action ÷ total prospects or visitors evaluated.
The conversion rate of leads to customers is an especially solid KPI because it directly connects the quality of segmentation with real income. Furthermore, measuring it by branch or by channel, such as WhatsApp versus email, helps detect bottlenecks and attribute sales to specific campaigns, as explained in this analysis on essential KPIs for smart CRM.
If conversion goes up but the ticket falls, celebrating is not enough. You must check if the promotion is attracting low-profitability purchases.
A simple operational example
A coffee shop may detect that a branch has good flow but a weak ticket. The goal should not be to "do more marketing." It should be to improve the average ticket with a complementary offer and check if the change is sustained.
A car wash may notice that many customers do not return after a certain time. The goal should not be to "send more messages." It should be to reduce the group of inactive customers and measure how many return after a specific campaign.
That shift in language seems minor, but it completely changes the quality of decisions.
From Data to Profits with Swirvle
A coffee shop owner in Guadalajara reviews sales at closing and sees a "good" week. The cash register moved. The problem appears later. They do not know if frequent customers grew, if the promo lowered margins, or if a branch sold more just due to passing traffic. Without that reading, the business works hard and improves little.
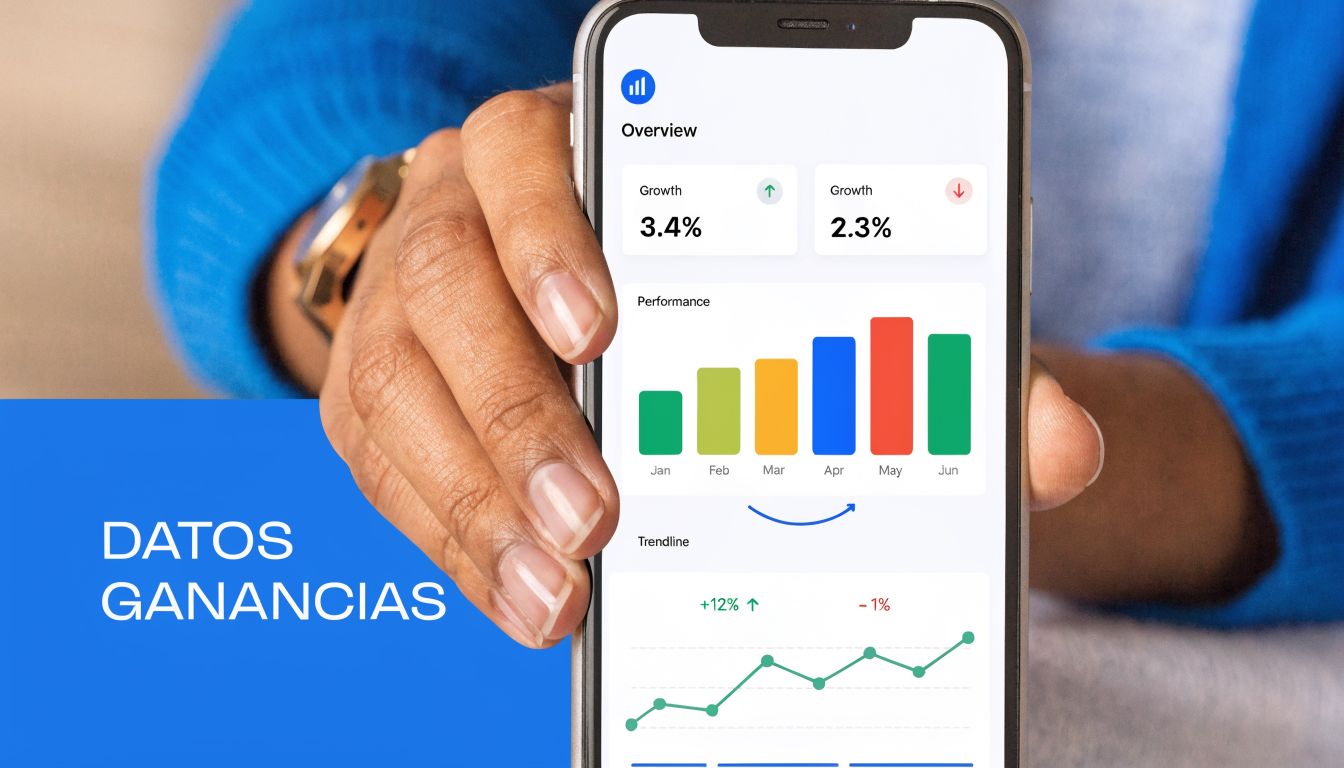
Measuring manually slows down profitability
The spreadsheet is useful at the beginning. Then it starts to take a toll. Customers are duplicated, counter sales are mixed with campaigns, and the reporting arrives too late to correct in the same week.
The real cost is not in the file. It is in the slow reaction. A car wash detects too late that its every-15-day customers have gone a month without returning. A restaurant keeps pushing a promotion that raises low tickets but leaves no profit. A small chain of barbershops sends the same message to everyone because no one separated customers by frequency, recency, or spend.
In Mexico, many SMBs have already moved from basic registration to the need to operate with better commercial control, as pointed out earlier with the advance of analytics and automation. The practical difference is no longer "having data." It is in turning it into specific actions that protect margins, repeat visits, and recover sleeping customers.
Swirvle concentrates customers, purchases, branches, and campaigns into a single workflow. This allows reviewing purchase frequency, average ticket, recurrence, return per campaign, and behavior by segment without exporting lists every week.
Measuring well works when the operation changes
A KPI alone does not deposit more money into the account. The decision that comes from that KPI does.
If a taco shop detects that new customers do not return in the first 20 days, the correct action is not to send another mass promotion. It is best to activate a specific campaign for the second visit, with a controlled offer and a clear return goal. If a beauty salon finds that its VIP customers stopped coming with the same frequency, it needs alerts and follow-up, not just a pretty report.
That is where automation actually pays off.
Instead of reviewing data on Friday and acting the following Tuesday, the business can set predefined rules based on real behaviors. When recency drops, reactivation is triggered. When the ticket goes up in a branch, you check what changed and replicate it. When a channel converts better for a certain segment, you adjust investment toward that channel.
Some uses that actually drive results:
Inactive customers: identifying who stopped buying within a useful window and activating a comeback campaign before they go completely cold.
Branches with unequal performance: comparing ticket, frequency, and conversion to find a local operational problem, rather than assuming "the area is slow."
Campaigns by channel: measuring if WhatsApp, push, or email generate real repeat purchases, not just opens or clicks.
Loyalty with profitability: verifying if points or rewards increase repeat visits and margins, or if they just give discounts to customers who would have bought anyway.
For businesses that want to connect cash flow, customers, and repeat purchases without complicating daily operations, it is worth checking out how a POS software with integrated loyalty program for physical businesses works.
Profitability improves when the indicator triggers a concrete action, on time and targeting the right customer.
Practical Cases of Automation and Improvement
The success indicators become useful when they land on concrete decisions. No grandiloquent stories are needed. It is enough to see how an operation changes when it stops sending messages to everyone equally and starts acting according to real behavior.
Neighborhood coffee shop focused on recurrence
A coffee shop in Puebla had a common perception: "there is always movement." The problem was that most of the commercial effort went into attracting new customers, while the existing base returned less than expected. The cash register moved, but recurrence was not clear.
The fix was simple. First, customers were separated by visit habit. Then, different stimuli were designed for those who bought often and for those who had stopped returning. The central indicator was not campaign reach, but visit frequency per customer.
In a short time, management stopped asking how many messages were sent and started reviewing how many customers returned. That change allowed adjusting schedules, rewards, and messages with much more precision.
Car wash with reactivation by recency
A car wash in the State of Mexico faced a different problem. The team knew there were valuable customers, but lacked clear visibility into when they stopped returning. Everything depended on staff memory or manually reviewing tickets.
The operational solution was to work with recency. The group that had gone too long without a visit was identified, and a reactivation campaign was launched with a specific incentive. The primary KPI was not the amount of messages opened, but how many of those customers returned and how much they spent upon returning.
A recovered customer is worth more when you know how long they had been inactive and what offer managed to move them.
Chain with branches that no longer compare blindly
A retail chain with a presence in different Mexican markets can make a common mistake: looking only at the consolidated total. When that happens, a strong store masks another with problems. The corporate team believes the business is doing well, but one branch drags down low conversion, poorly executed promotions, or a less loyal customer base.
The improvement comes when equivalent indicators are compared between locations. Sales are not enough. It is necessary to look at repeat purchases, tickets, and responses to local campaigns. This avoids penalizing the entire chain for a single branch and also detects practices that are actually worth replicating.
Start Measuring Your Success Today
It's 9 PM, the register has closed, and there was movement all day. Even so, it is not clear if that effort left a profit or just operational wear and tear. That is the point where it is useful to start measuring well.
An SMB does not need ten reports to make better decisions. It needs two or three indicators that actually change the operation. In a neighborhood coffee shop, it is usually convenient to watch average ticket and visit frequency. In a car wash, recency and customer return. In a business with multiple branches, conversion and repeat purchases by location to detect which store is truly growing and which one is just selling by inertia.
Measuring well has a direct effect on cash flow. It allows adjusting promotions before they eat up the margin, changing schedules before losing frequent customers, and cutting campaigns that generate noise but not sales.
It also prevents a very common mistake in physical businesses in Mexico: confusing activity with progress. Keeping the team busy, posting promotions, sending messages, and seeing people enter does not guarantee a better result. What matters is how much each customer buys, how often they return, and what action made them come back.
That is why success indicators are useful in practice. They help decide what to repeat, what to correct, and what to stop doing.
Swirvle enters this process as an operational tool. It centralizes customer, campaign, and loyalty information so that the business does not just see loose numbers, but can convert them into automatic actions, such as reactivating inactive customers, driving a second purchase, or detecting which branch needs immediate attention.
If today you still review sales at closing and little else, start with a simple question: what number, if improved this month, leaves more money in the bank? That is usually the correct KPI to start with.
Related Blogs

Sep 19, 2026
Effective promotions to increase sales during low-traffic hours: 2026 guide

Sep 18, 2026
Examples of coffee shop loyalty programs (physical and digital)

Sep 17, 2026
Pros and cons of the "free coffee for the first 100 customers" promotion

Sep 16, 2026
How to organize a private coffee tasting: a practical guide

Sep 14, 2026
How to optimize Google Business Profile for barber shops

Sep 13, 2026
The best customer retention software for coffee shops
Try Swirvle for free
No card required · 30 days free
Start your free trial