
Practical profitability analysis guide for SMEs: metrics, formulas, examples by branch and campaign, and how to use your CRM to make data-driven decisions.
A busy coffee shop in Mexico City, a car wash with a line in Monterrey, or a gas station with a constant flow can all close the month with the same question: why are sales going up, but the profit is nowhere to be found? The problem usually lies in the gap between billing and profitability. Selling more does not guarantee earning more if each transaction consumes too much margin, if a branch absorbs disproportionate costs, or if a campaign attracts customers who buy at a discount and never return.
Profitability analysis turns that frustration into concrete decisions. It allows you to separate the effect of sales, costs, assets, recurrence, and campaigns to know which product, customer, or point of sale actually creates value.
Why your SME sells well but does not generate the expected profit
A coffee shop owner can celebrate a week with full tables and more to-go orders. However, when checking the bank account, they discover that the outcome did not change. Rent, payroll, delivery commissions, waste, and discounts consumed the growth. The store sold more, but each additional peso produced a smaller contribution.
Something similar happens at a car wash in Monterrey. A promotional package can increase the number of services, but if it includes labor-intensive jobs in terms of water, staff, and time, the volume does not necessarily represent a better business. A manager looking only at gross revenue may reward a promotion that reduces the profit per service.
Rule of thumb: a sale is only good when, after considering its direct costs and the corresponding portion of operating costs, it leaves a sufficient contribution.
The difference between selling more and earning more
Gross income answers how much the business collected. Profit answers how much was left over after covering the cost of sales and the expenses necessary to operate. That difference requires reviewing the income statement and balance sheet, not just the payment terminal or the daily report.
In Mexico, ROA, ROE, gross margin, and operating margin indicators offer a methodological basis for comparing profit with sales, assets, or equity. ROA can be calculated as earnings before interest and taxes divided by total assets, while ROE uses net income divided by book value, as explained in the academic study on profitability ratios in SMEs.
The correct reading seeks to answer three questions:
Sales: which products, services, and times generate revenue?
Costs: how much does it cost to produce and deliver each sale?
Assets: are the branch, equipment, and inventory producing sufficient profit?
The problem of costs that no one allocates
A branch may seem profitable because the report loads direct ingredients and payroll to it, but omits maintenance, administration, local advertising, commissions, depreciation, or waste. The result is an inflated profit. A coffee shop in Mexico City can bill well and still yield less than one in Puebla if it faces a heavier fixed structure.
The analysis should be updated every month and broken down by product, branch, channel, and campaign. The Mexican case also shows that size matters. An OECD report based on the INEGI Economic Census recorded, for trade in 2011, profitability levels of 72 for micro-enterprises, 317 for small ones, and 445 for medium ones, with a much greater magnitude in large enterprises; in 2008, the figures were 77, 302, and 396, respectively, before considering the level of large enterprises, according to the cited report on corporate profitability in Mexico. The difference reflects the unequal capacity to absorb fixed costs, negotiate inputs, and leverage assets.
Key profitability metrics and how to calculate them
A useful dashboard starts with simple formulas but requires consistent data. Economic and financial profitability must be linked to financial statements, while commercial metrics explain what behavior produced that result.
The breakdown of profit and loss for physical retailers helps organize revenue, cost of sales, gross profit, operating expenses, and net profit before interpreting the indicators.
Basic financial indicators
The gross margin shows how much is left after the direct cost of selling a product or service:
Gross margin = (Sales − Cost of sales) / Sales × 100
If a coffee shop sells drinks and food for 85 pesos in an operation and the direct cost of ingredients is 38 pesos, the gross margin for that sale is 47 pesos. To express it as a percentage, that difference is divided by sales and multiplied by 100.
The operating margin discounts expenses such as payroll, rent, utilities, maintenance, and advertising. Its practical formula is:
Operating margin = Operating income / Sales × 100
ROA measures the profit generated by assets:
ROA = Earnings before interest and taxes / Total assets × 100
ROE looks at the return on equity:
ROE = Net income / Shareholders' equity × 100
These ratios answer different questions. ROA is used to evaluate whether a store, a washing equipment, or a station is leveraging its resources. ROE allows for assessing the return on the capital contributed by the owners.
Commercial metrics to understand profit
The average ticket is obtained as follows:
Average ticket = Total sales / Number of transactions
In a coffee shop in Puebla, if an average transaction is 85 pesos and the ingredients cost 38 pesos, the margin per sale before operating expenses is 47 pesos. The data is not enough by itself, but it allows for comparing products, times, and branches.
The margin per customer must include the cumulative value of their purchases:
Margin per customer = Customer revenue − Associated variable costs
The LTV, or customer lifetime value, can be estimated with an operational formula:
LTV = Average ticket × Purchase frequency × Duration of the relationship × Gross margin
For a car wash in Nuevo León, a customer who visits 3.2 times a month and maintains a constant ticket and margin has a higher value than another with just an occasional single visit. The frequency must be calculated with real business data, not a commercial expectation.
The CAC measures how much it costs to acquire a customer:
CAC = Acquisition investment / Attributable new customers
The ROI per campaign should use attributable profit, not gross sales:
ROI = (Incremental attributable profit − Campaign investment) / Campaign investment × 100
Metric | Formula | Practical example |
|---|---|---|
Gross margin | (Sales − Cost of sales) / Sales × 100 | A coffee shop compares drinks and food according to their direct cost |
Margin per sale | Price − Variable costs | An 85-peso ticket minus 38 pesos of ingredients leaves 47 pesos before operating expenses |
Average ticket | Sales / Transactions | Allows for comparing branches and times |
LTV | Ticket × Frequency × Duration × Margin | A car wash analyzes the value of a recurring customer |
CAC | Investment / New customers | Measures how much it costs to attract new buyers |
Campaign ROI | (Attributable profit − Investment) / Investment × 100 | Avoids confusing promotional sales with actual return |
The right decision depends on the indicator. A low ticket can improve with cross-selling, a weak LTV may require a recurrence strategy, and a high CAC may force a review of segmentation or the acquisition channel.
Profitability analysis by product, branch, and campaign
An SME with multiple stores does not have a single profitability level. It has a combination of products, locations, and commercial actions with different results. The dashboard must maintain that granularity to prevent a profitable branch from subsidizing another without the owner detecting it.

Product and real margin
The product that sells the most is not always the one that leaves the most profit. A coffee shop may move a high volume of a discounted drink, while a lower-turnover product contributes a higher margin per transaction. The analysis must include net price, ingredient costs, packaging, commissions, waste, and preparation time.
The cost of sales requires a uniform definition. The guide on how cost of sales is determined can serve as a reference to organize the calculation and prevent each branch from using different criteria.
Branch and local structure
A chain of three coffee shops in the State of Mexico may find that the branch with the highest billing has the lowest net margin. The explanation could lie in high rent, an oversized staff, unproductive hours, or higher waste. The comparison must distribute local fixed costs and separate corporate expenses that do not directly depend on the store.
INEGI Economic Censuses registered 69,599 economic units, 209,685 employed individuals, and 45,945.46 million pesos in service revenue for coffee shops, soda fountains, ice cream parlors, snack shops, and similar establishments in the restaurant industry table; the same material identifies a concentration of 59,975 units in the State of Mexico. This data, available in the INEGI sector table, helps contextualize competitive pressure and scale diversity, but each branch must be measured with its own costs.
Campaign and incremental utility
A campaign in Yucatán can boost sales and still reduce profit per unit if the discount exceeds the available margin. The calculation must compare the behavior of the exposed group with a reasonable benchmark, discount organic redemptions, and solely attribute purchases linked to the action.
The minimum dashboard should show:
Product: units, net sales, variable cost, margin, and waste.
Branch: sales, margin, rent, payroll, utilities, and operating profit.
Campaign: investment, new customers, attributable purchases, incremental margin, and subsequent recurrence.
In Mexico City, INEGI registered 44,141 food preparation and service establishments at the close of 2020, including 7,074 coffee shops and similar businesses. Benito Juárez concentrated 3,845 total establishments and 771 similar coffee shops, according to the INEGI establishment table for Mexico City. In dense markets, comparing branches by profit, and not just sales, is indispensable.
The hidden profitability in customer retention and loyalty
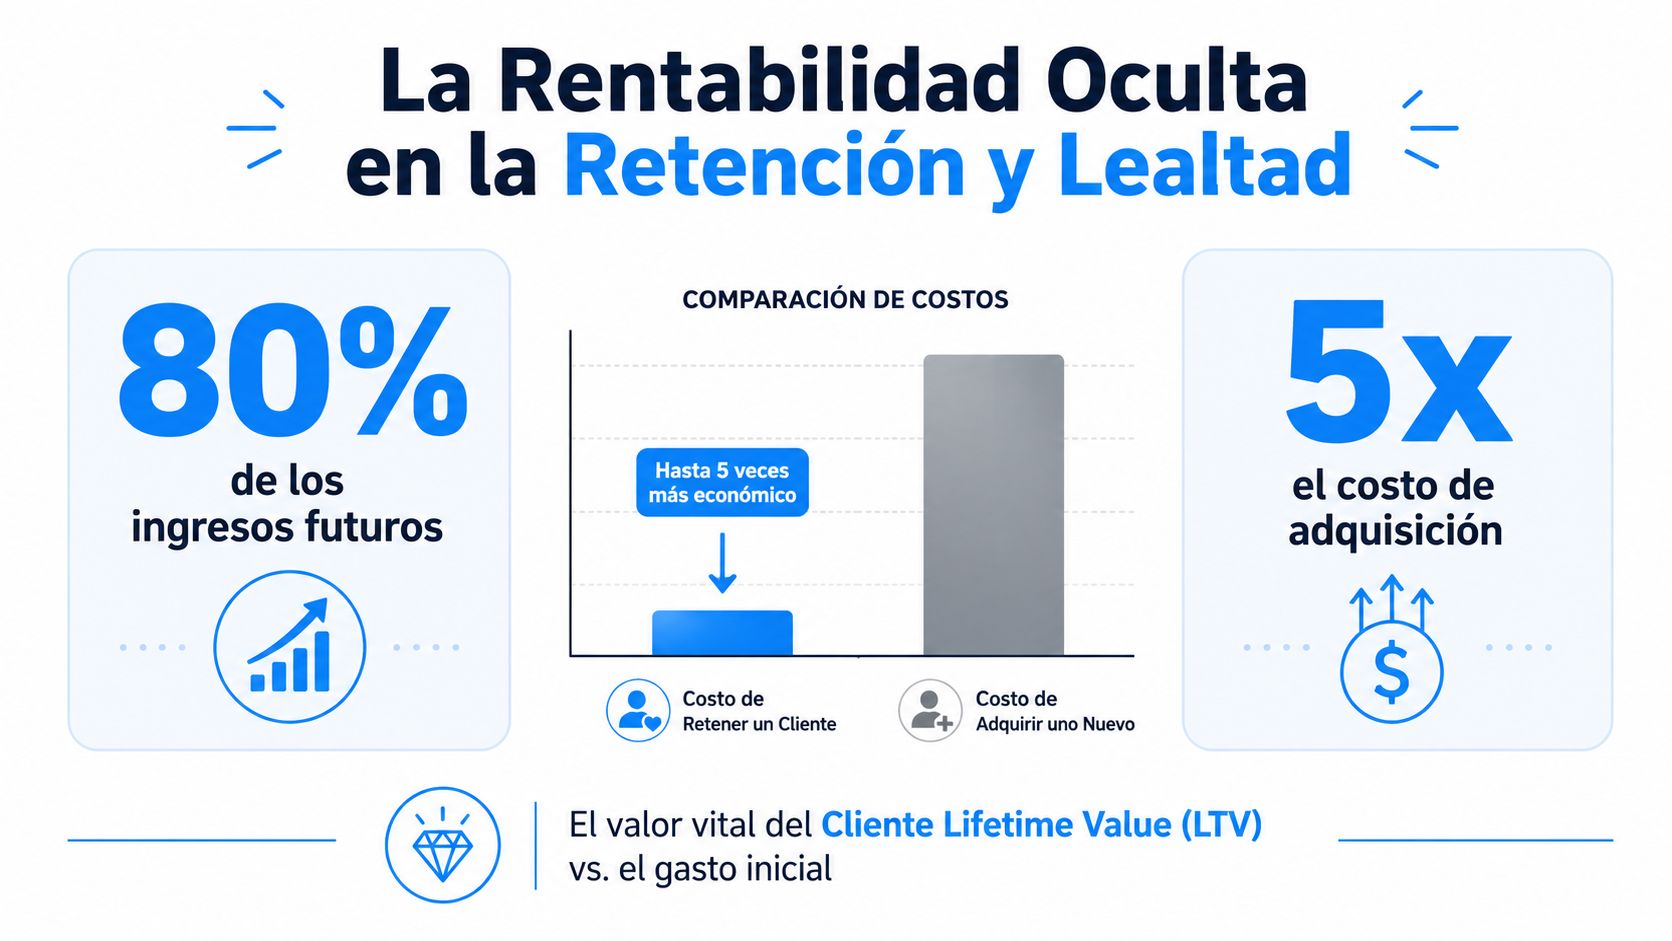
The operating margin explains how much a transaction leaves. Retention explains how many times that transaction can be repeated without paying the full acquisition cost again. Therefore, a profitability analysis that ignores recurrence, churn, and customer experience is incomplete.
A consumer can switch coffee shops, barbershops, or car washes for a more convenient reward. EY reported that 91% of consumers switch brands if they find better benefits, and customer experience studies in Mexico show that 33% abandon a brand after poor customer service, according to the EY reference on loyalty in Latin America. The figure does not indicate how much each business loses, but it does point out that experience and benefits have a direct relationship with retention.
From frequency to net profit
A barbershop in Baja California can segment its customers by frequency, ticket, and margin. If a person visits regularly, accepts additional services, and responds to reminders, their economic value is nothing like that of a customer who visits only once through an aggressive discount.
The calculation must avoid automatic promises. For each cohort, the business can track:
Frequency: how many visits the customer registers during the period.
Margin: how much remains after the variable costs of their services.
Retention: how many return in the following period.
Communication cost: how much is invested to activate or maintain the relationship.
Purchase frequency can increase LTV without generating the same expense as an acquisition campaign. But a poorly designed reward can also destroy margin. The benefit must be tied to a profitable action, such as a second visit, a package with complementary services, or a higher-contribution purchase.
Loyalty that does not rely on indiscriminate discounts
The common mistake is calling any promotion loyalty. A useful program identifies habits and allows offering relevant incentives by branch and segment. A car wash can remind about recurring maintenance, a coffee shop can trigger a reward after several visits, and a barbershop can reach out when the customer approaches their usual interval.
The customer lifetime value framework helps connect recurrence with margin, but the final decision must use own figures. Each business must compare the incremental margin generated by retention against the cost of the reward, communication, and operation.
The right question is not whether a campaign produced more visits. It is whether it produced additional net profit, in which branch, for which cohort, and for how long. That reading changes the budget: it reduces reliance on broad discounts and prioritizes experiences that increase the likelihood of return.
Common mistakes that distort your profitability analysis
SMEs usually have enough data to identify their problems, but they group them in a way that hides the cause. An analysis can seem organized and still be useless if it mixes branches, periods, or customer types.

Five failures that must be corrected
1. Confusing gross revenue with net profit.
The warning sign appears when management celebrates record sales, but available cash does not improve. The correction consists of subtracting cost of sales, operating expenses, commissions, taxes, and financial costs before evaluating the result.
2. Failing to allocate fixed costs by branch.
A gas station may charge the same administrative cost to all stations even if they have different structures. Each unit must absorb the local costs it actually generates and a reasonable portion of shared costs.
3. Ignoring the actual cost of acquisition.
A campaign does not only cost the payment to the medium. It can also include design, production, incentives, staff, and discounts. If those elements are left out of the CAC, the customer seems more profitable than they actually are.
4. Measuring ROI with attributed sales.
Attributed sales do not equal attributable profit. The formula must deduct the variable cost of the product and the campaign investment, in addition to separating purchases that would have occurred without the promotion.
5. Failing to update prices at the pace of inputs.
When ingredients, water, energy, spare parts, or payroll rise, the historical margin stops representing current operations. The manager must review prices, recipes, packages, and product mix with a defined frequency.
The gas station that seemed profitable
In Mexican service stations, an industry source reports an average gross margin of around 8% and notes that the average monthly salary for forecourt staff is around 550 dollars, an amount equivalent to close to 18% of the gross margin generated by the station, according to the service station industry analysis. The data shows why a station in Nuevo León can overestimate its profitability if it reviews fuel sold but does not link payroll and margin.
A quick audit should compare each figure with its origin, period, and business unit. If the report does not allow answering which customer, product, branch, or campaign produced the profit, it is not yet useful for decision-making.
How to automate your profitability analysis with a CRM
Spreadsheets work to organize a small operation, but they lose value when sales, customers, and campaigns live in separate files. The primary goal of automation is not to fill out more reports, but to connect each transaction with a person, a branch, a product, and a commercial action.

The operational flow
Capture. Each purchase must register the customer, date, branch, products, amount, discount, and channel. In a coffee shop, it is also useful to keep modifiers and applied promotions to avoid losing the actual cost of the sale.
Centralize. The CRM gathers history, segments, visits, and campaign responses. Thus, the business can distinguish between a new, reactivated, and recurring customer, instead of adding up all purchases as if they had the same value.
Attribute. Each campaign needs concrete identification. WhatsApp, email, notifications, and coupons can be linked to purchases and branches to calculate incremental margin, CAC, and return.
Decide. Dashboards should show profit by branch, product, and cohort. The team can detect low-frequency customers, products with deteriorated margins, and campaigns that generate traffic but no contribution.
Swirvle centralizes customer and sales data, allows segmenting by consumption habits and branch, runs personalized campaigns via WhatsApp, push notifications, and email, and offers dashboards to measure ROI and attribute sales. Implementation should start with a single branch, a small set of metrics, and a consistent comparison period. Afterward, the business can adjust loyalty rules, rewards, and automations before extending them to Puebla, Yucatán, Baja California, Nuevo León, or any other region.
The priority data points are customer, branch, transaction, product, margin, campaign, discount, visit, and repurchase. With that basis, the analysis stops being a late review and becomes a system to protect profit month by month.
Swirvle helps physical store SMEs centralize customers, sales, and campaigns, measure recurrence, and attribute results by branch. To turn profitability analysis into operational decisions, the business can explore the features of Swirvle and start with a pilot focused on one branch and its recurring customers.
Related Blogs

Nov 10, 2026
How to manage multiple restaurant locations from a single system?

Nov 9, 2026
Which CRM is best for a small business in Mexico? 2026

Nov 8, 2026
What works better for a small business: WhatsApp promotions or email promotions?

Nov 7, 2026
How do you calculate a business's net purchases? Formula and example in MXN

Nov 6, 2026
How much does a point-of-sale system cost for a small business in Mexico?

Nov 5, 2026
How to Create an Executive Breakfast Menu to Sell to Offices: 2026 Guide