
How do I know who my best customers are? Discover how by using key KPIs like CSAT, NPS, and CLV. Increase the profitability of your SMB in Mexico this 2026.
A business owner experiences it all the time. A customer comes into the coffee shop, orders for the entire office, and leaves a high ticket. That same day, another person walks in, buys very little, greets the cashier by name, and returns several times a week. If the question is How do I know who my best customers are?, the same mistake is almost always made: focusing only on the one who spent the most just once.
That shortcut is expensive. In a taco shop in Puebla, a high-ticket customer may order for a party and not return for months. On the other hand, a family that dines every week, recommends the place, and hardly ever generates complaints sustains the business's cash flow much better. The same thing happens at a car wash in Monterrey, a gas station in Yucatan, or a small coffee shop chain in Mexico City.
The useful answer is not in gross sales. It is in understanding who delivers more value over time, who costs less to serve, and who is more likely to return. This logic is especially important in Mexico, where micro, small, and medium-sized enterprises contribute 52% of GDP and generate about 7 out of 10 jobs according to Novicap on most profitable customers. When an MSME misidentifies its best customers, it poorly distributes its discounts, service efforts, and campaigns.
Table of Contents
Introduction beyond the customer who spends the most
The best customer does not always leave the highest ticket. In many physical businesses, they leave something more important: repetition, margin, and stability. A customer who buys often, responds well to promotions, requires less staff time to solve problems, and returns without having to be chased is worth more than someone who appears once with a large purchase.
That point changes the way of measuring. If a bakery in Baja California reviews only sales for the month, it will reward the one who placed the large order for the weekend. If it reviews behavior over time, it will likely discover that its best customers are those who buy for every birthday, every family gathering, and every special date. They are not the most visible in a single snapshot. They are the most profitable when looked at as a whole.
The difference between selling a lot and earning more
Many businesses confuse revenue with profit. A customer may spend well but ask for discounts, complain more, use coupons on every visit, or buy only during peak seasons. Another may spend less per visit and still leave more accumulated profit due to their frequency and lower cost of service.
Rule of thumb: the best customer is not the flashiest. It is the one who leaves repeatable value.
That is why metrics like CLV, retention, frequency, and satisfaction work better. Together, they provide a better answer to the question of which customers sustain the business.
What a physical business must observe
In an MSME with branches, it is useful to look for very specific signs:
Real frequency: how often each customer returns.
Consistency by branch: whether they always buy at the same location or move between points of sale.
Probable margin: if they consume products or services that leave a better profit.
Service friction: if they buy easily or if they generate extra costs.
Response to campaigns: if they react to messages via WhatsApp, email, or notifications.
With that, the conversation changes. It is no longer about "who buys the most," but rather "who is worth retaining first."
What truly makes a customer the best
A valuable customer for a physical MSME is almost never defined by a single metric. They are better understood through three filters: profitability, loyalty, and growth potential. When one is missing, the analysis falls short.
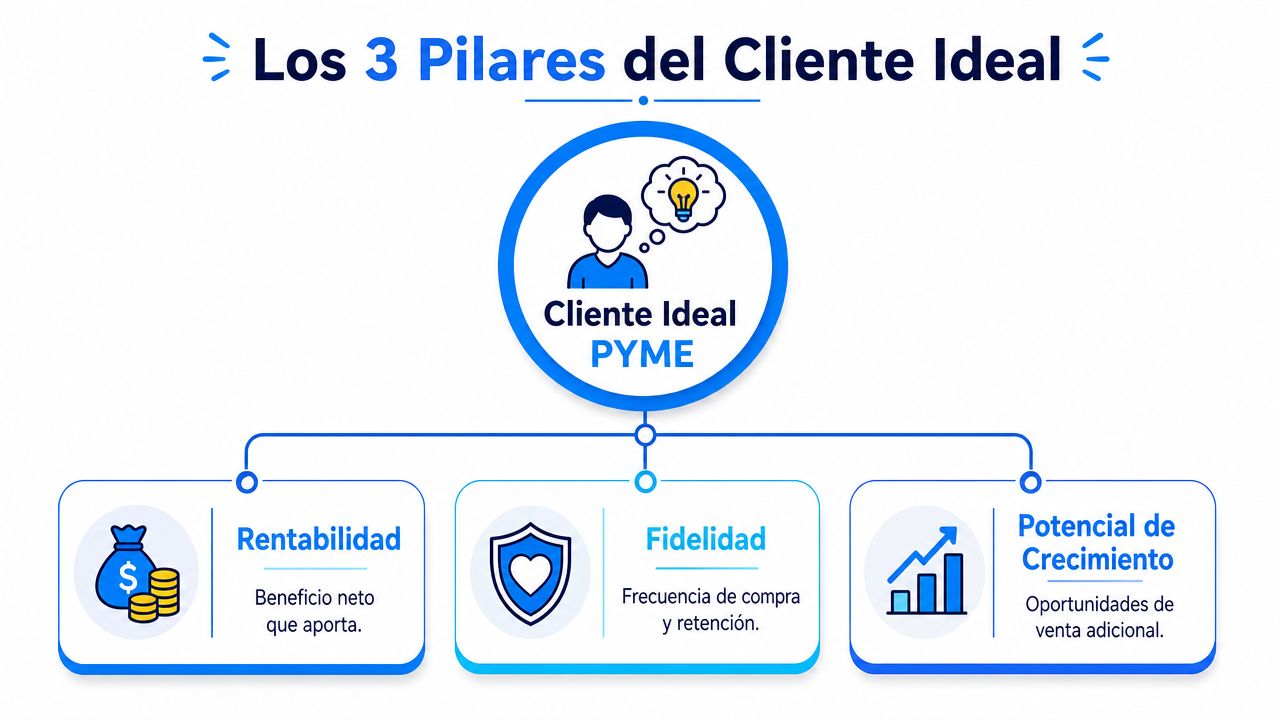
Customer evaluation methodologies recommend measuring the retention rate along with profitability, because a better customer is not necessarily the one who spends the most once, but the one who stays longer and costs less to serve, as explained by Calidad y Tecnología on value indicators and customer satisfaction.
Three filters that actually work
Profitability. This involves the profit left by the customer, not just the sale. In a car wash, for example, someone who buys the basic service just once is not worth the same as someone who returns regularly and also adds waxing or interior detailing on different visits.
Loyalty. Purchase frequency and longevity over time say much more about the customer's future value. In a business with multiple branches, it is also useful to detect whether the relationship depends on a single location or on the entire brand.
Growth potential. Not all good customers are already at their maximum value. Some still buy one product line, but have clear room for cross-selling, packages, or memberships. When a business starts to segment, it usually discovers these groups more clearly. To better understand this grouping logic, it is helpful to review how a customer cluster works in a physical business.
What usually goes wrong
There are three common mistakes in MSMEs:
Rewarding only the one-time high spender: this distorts discounts and benefits.
Measuring only sales: if not crossed with recurrence, the data is misleading.
Using demographics as the main criterion: age or area help little if they are not connected to actual habits.
A frequent customer with a good experience and low operational friction is usually worth more than an occasional high-ticket buyer.
In coffee shops, gas stations, and small retail stores in the State of Mexico or Nuevo Leon, this difference is quickly seen. The business that detects it stops giving "one-size-fits-all" incentives and starts investing in the person who actually sustains the operation.
The 5 KPIs to identify your star customers
If the question is how to know who the best customers are, these five KPIs provide a practical reading. There is no need to set up an analytics lab. You need to measure consistently and make decisions with criteria.
A better customer is defined by combining CLV or LTV, retention rate, NPS or CSAT, and purchase frequency. In addition, CLV can be estimated by multiplying the average purchase value by the purchase frequency and by the customer's lifespan, according to UserGuiding on customer success metrics.
1. CLV or customer lifetime value
The CLV answers how much value a customer contributes throughout their relationship with the business. For a physical MSME, it is one of the most useful metrics because it forces you to look beyond the current visit.
Simple way to calculate it:
CLV = average purchase value × purchase frequency × customer lifespan
If a coffee shop in CDMX observes that certain customers buy several times a week over long periods, those profiles should receive preferential attention, relevant benefits, and reactivation campaigns before other segments.
To delve deeper into this logic, this guide on how to calculate customer lifetime value is useful.
2. Retention rate
Retention shows how well the business keeps its customers. It is not enough to attract visits. A healthy physical business needs repetition.
In daily operation, this metric helps answer questions like these:
By branch: which one retains better.
By channel: which campaigns bring in customers who actually return.
By segment: who stays longer without depending on aggressive discounts.
A casual restaurant in Puebla can sell well on weekends and still have weak weekday retention. That nuance does not appear when only looking at revenue.
3. Purchase frequency
Frequency is a direct sign of habit. In recurring businesses, it is usually more useful than an isolated ticket.
It is useful to read it alongside recency. A customer who used to come a lot and stopped appearing deserves a different action than one who buys little but remains active. At a car wash in Nuevo Leon, for example, frequency allows separating someone who only took advantage of a promotion from the customer who has already integrated the service into their routine.
Operational tip: if a customer decreases their frequency, they are not always lost. Sometimes they just need the right reminder at the right time.
4. NPS and CSAT
Here enters the quality of the experience. Two customers may spend the same, but one is satisfied and recommends, while the other buys with friction and is about to leave.
CSAT is used to measure immediate satisfaction after a visit or service. NPS helps detect promoters, passives, and detractors.
In a small coffee shop chain, NPS can reveal something that sales do not show: a branch sells well because it is in a good location, but leaves a weak experience. If that is not corrected, sooner or later it affects recurrence.
5. Average ticket with context
The average ticket does matter, but never alone. It is useful when crossed with frequency, retention, and satisfaction.
A high-ticket customer with low frequency may be opportunistic. A medium-ticket customer with stable frequency and good CSAT is usually more profitable over time. At a gas station, moreover, this KPI helps see if there is cross-selling in the convenience store, coffee, or snacks.
Summary of key KPIs for MSMEs
KPI | What It Measures | How It Is Calculated (Simple Form) | Ideal for |
|---|---|---|---|
CLV | Accumulated value of the customer over time | Average purchase value × frequency × lifespan | Prioritizing profitable segments |
Retention rate | Customer retention | Tracking customers who return in a period | Evaluating actual loyalty |
Purchase frequency | Visit or purchase habit | Number of purchases per customer in a period | Recurring businesses |
NPS / CSAT | Satisfaction and willingness to recommend | Post-purchase or post-service survey | Improving experience and detecting risk |
Average ticket | Amount per transaction | Total sales divided by number of tickets | Analyzing value per visit |
A common mistake is wanting to use too many indicators at the same time. For a physical MSME, it is enough to start with these five and review them by branch, cohort, or customer type.
KPIs in action examples in Mexican businesses
KPIs are useful when they change decisions. If they do not alter promotions, service, or follow-up, they only decorate reports. In physical Mexican businesses, the best proof is in how they help separate high-value customers, at-risk customers, and potential customers.

Evidence from the ENIGH 2022 shows that household spending in Mexico is concentrated in categories of frequent consumption. For physical businesses, this makes it vital to measure Recency, Frequency, and Monetary Value (RFM) to detect repetition, as summarized by IBM on key customer service metrics.
Car wash in Monterrey
At a car wash, the best customer is rarely the one who ordered the premium package just once. It is usually the one who returns regularly, buys complementary services, and responds when they receive a reminder before the weekend.
A useful reading would be:
High frequency and medium ticket: high-value base customer.
High ticket and low frequency: occasional customer who should not be over-rewarded.
Falling frequency: customer for a reactivation campaign.
Here, CLV and frequency are used to design a simple visit or rewards club, without giving away too much margin.
Coffee shops in Mexico City and State of Mexico
A small chain with several branches can use RFM to find customers who maintain a consistent pattern. Someone who buys coffee and bread several times a week does not always stand out in ticket amount, but they do in income stability.
NPS helps detect promoters and ask them for reviews or recommendations. CSAT helps discover if a branch has specific problems with service, times, or perceived quality. If a store has good sales but lower satisfaction, the business already knows where to intervene first.
A customer who repeats and recommends is worth double. They buy and also reduce future marketing effort.
Gas station in Yucatan
At a gas station, fuel can make it seem like all customers are similar. They are not. There are those who just fuel up and leave, and those who add coffee, water, snacks, or a quick wash.
The average ticket with context helps distinguish:
Transient customer: isolated purchase, no clear relationship.
Regular customer: fills up often at the same station.
Cross-selling customer: leaves more total value per visit.
When the business crosses frequency with ticket and response to promotions, it can activate more precise offers. It makes no sense to send the same campaign to everyone.
How to implement and measure these KPIs in your MSME
The problem is not usually understanding the metrics. The problem is landing them in the operation. Many physical MSMEs already have data, but it is scattered between the cash register, messages, spreadsheets, and the manager's memory.
In addition, identifying the best customers in businesses with physical recurrence goes beyond purchase history. It is also useful to measure the response to campaigns via WhatsApp or email, something especially relevant in a context where retail e-commerce in Mexico reached 789.7 billion pesos in 2024, as reported by Zendesk on ideal customer and personalization.
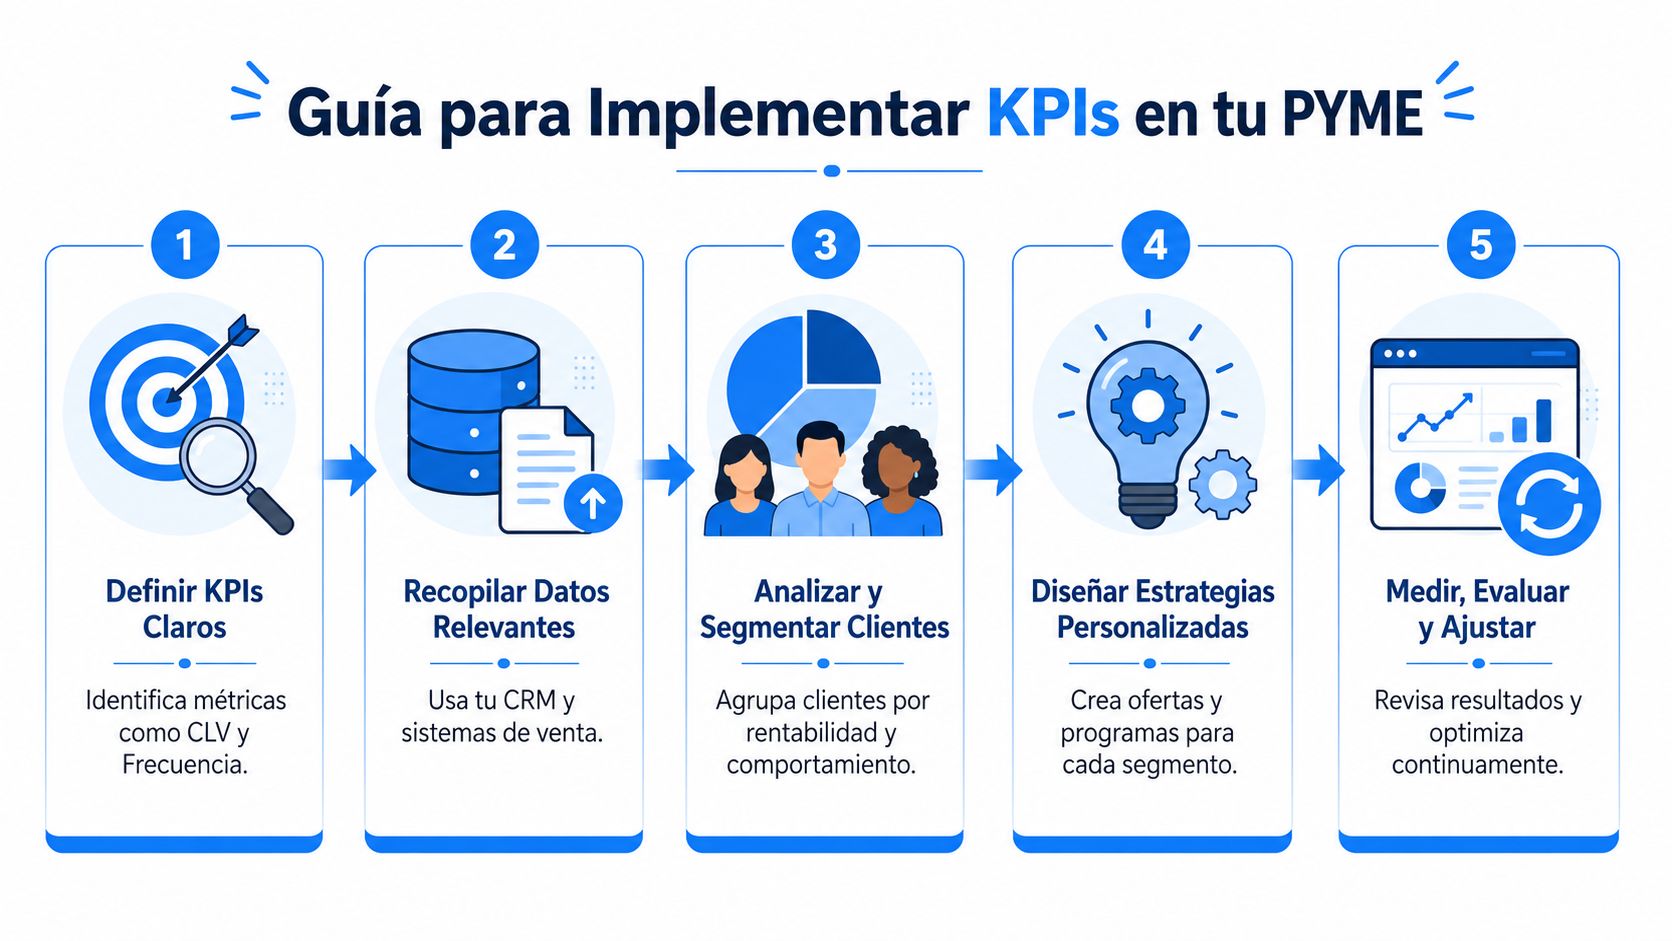
Step 1 choose a few metrics and use them well
The first step is simple: choose a few KPIs and make them a routine. For most physical businesses, CLV, frequency, retention, CSAT, and average ticket are enough.
It is not advisable to start with twenty reports. It is useful to answer four questions:
Who returns the most
Who leaves the most accumulated value
Who is satisfied
Who stopped coming
Step 2 capture data from daily operations
Here many companies hold back because they believe a complex infrastructure is needed. Not always. The essential thing is to be able to link purchases and visits with a customer identity.
That can be done with simple elements:
Phone number or customer ID: to recognize recurrence.
Registration by branch: to compare behavior between points of sale.
Short post-visit surveys: to obtain CSAT or NPS.
Campaign history: to see which messages generate a return.
A modern CRM helps because it centralizes purchases, visits, responses, and segments. One option for this type of operation is Swirvle, which connects customer data from physical stores, segments by habits and branch, and allows activating campaigns and reviewing results in the same flow.
Step 3 segment and act
Measuring without segmenting is of little use. Action is born when the business divides the base into groups with commercial logic.
For example:
Star customers: high frequency, good ticket, high satisfaction.
Customers with potential: medium frequency, positive response to campaigns.
At-risk customers: high recency, they used to buy often.
Occasional customers: isolated purchase, no return pattern.
A clear dashboard helps operate this better. This guide on how to use a sales dashboard shows well how to convert scattered data into decisions by segment and branch.
Check point: if a segment does not trigger a different action, it is not a useful segment.
Step 4 review by branch and adjust
In businesses with multiple locations, it is never advisable to read the general average as if it told the whole story. A coffee shop in the State of Mexico may have very loyal customers in one branch and silent loss in another. A car wash in Baja California may respond better to weekday campaigns than one in Nuevo Leon.
The correct discipline is to review each period and adjust:
Promotions: which ones actually bring repetition.
Service: where CSAT drops.
Frequency: which customers are cooling off.
Cross-selling: which products increase value without damaging experience.
Real improvement appears when the business stops sending the same incentive to everyone and starts rewarding profitable behaviors.
Conclusion convert customer data into real profits
The question How do I know who my best customers are? is not solved by intuition or by the month-end sales report. It is solved by looking at behavior, repetition, satisfaction, and accumulated value. This allows protecting margin, allocating promotions better, and focusing team time on those who truly sustain the business.
For a physical MSME, this is not marketing theory. It is daily operation. A taco shop in Puebla, a coffee shop in CDMX, a gas station in Yucatan, or a car wash in Monterrey can use the same principle: identify who to retain, who to reactivate, and who does not make sense to over-subsidize.
It also changes the way of growing. Instead of chasing the whole market with generic messages, the business works with clear segments. It rewards the right customers. It detects drops in frequency before they turn into loss. And it uses satisfaction and campaign response as signs of future value.
The current advantage is that this analysis is no longer reserved for corporations. A small business can start with a few KPIs, capture basic data, and turn them into concrete actions. When that happens, each visit stops being just a sale. It becomes a signal to make better decisions.
If an MSME wants to centralize purchases, recurrence, campaigns, and segments in one place, Swirvle allows organizing that data and using it to retain more customers, measure better, and grow with decisions based on actual behavior.
Related Blogs

Sep 19, 2026
Effective promotions to increase sales during low-traffic hours: 2026 guide

Sep 18, 2026
Examples of coffee shop loyalty programs (physical and digital)

Sep 17, 2026
Pros and cons of the "free coffee for the first 100 customers" promotion

Sep 16, 2026
How to organize a private coffee tasting: a practical guide

Sep 14, 2026
How to optimize Google Business Profile for barber shops

Sep 13, 2026
The best customer retention software for coffee shops
Try Swirvle for free
No card required · 30 days free
Start your free trial